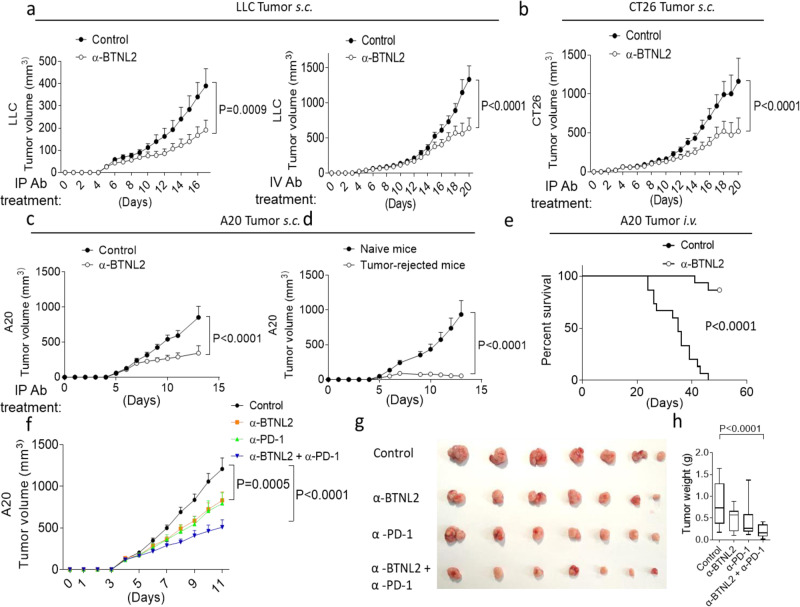
Fig. 1. Anti-BTNL2 mAb has therapeutic effect for multiple tumours.
a Primary LLC tumour growth kinetics of mice after intraperitoneal injection of isotype rat IgG1 control Ab or anti-BTNL2 mAb (200 μg/mouse) (left panel) or intravenous injected of antibody (200 μg/mouse) (right panel) was shown. (n = 13, P = 0.0009 for left panel, and n = 14, P < 0.0001 for right panel). b, c Primary CT26 (b, n = 14 for each group, P < 0.0001) or A20 (c, n = 17 for each group, P < 0.0001) tumour growth kinetics of mice after intraperitoneal injection of antibody (200 μg/mouse) was shown. d Tumour free mice from anti-BTNL2 mAb treated group in c were re-implanted A20 tumours in the contralateral flank of mice, and tumour growth kinetics of mice was shown (n = 12 for each group, P < 0.0001). e Mice were intravenous injected 2 × 10⁶ A20 tumour cells, followed by intraperitoneal injection of isotype control Ab or anti-BTNL2 mAb as described in the Materials and methods (n = 15 for each group, P < 0.0001) (200 μg/mouse). Mice survival was shown. f Primary A20 tumour growth kinetics of mice after intraperitoneal injection of control Ab, anti-BTNL2 mAb, anti-PD-1 mAb or anti-PD-1 mAb plus anti-BTNL2 mAb was shown. (200 μg/mouse of anti-BTNL2 mAb and 100 μg/mouse of anti-PD-1 mAb) (n = 13 for each group, P = 0.0005 for Control vs α-BTNL2, P < 0.0001 for Control vs α-BTNL2 + α-PD-1, 4 × 10⁶ A20 cells were subcutaneously injected). g Tumour image from f was shown. h Tumour weight was shown (n = 13 for each group, P < 0.0001 for Control vs α-BTNL2 + α-PD-1, 4 × 10⁶ A20 cells were subcutaneously injected). All data are mean ± s.e.m. *P < 0.05, **P < 0.01, ***P < 0.001, ****P < 0.0001 based on Two-way ANOVA for (a–d, f), Log-rank (Mantel-Cox) Test for (e) and one-way ANOVA for (h). Data are representative of three independent experiments (a–e) and two independent experiments (f–h).

