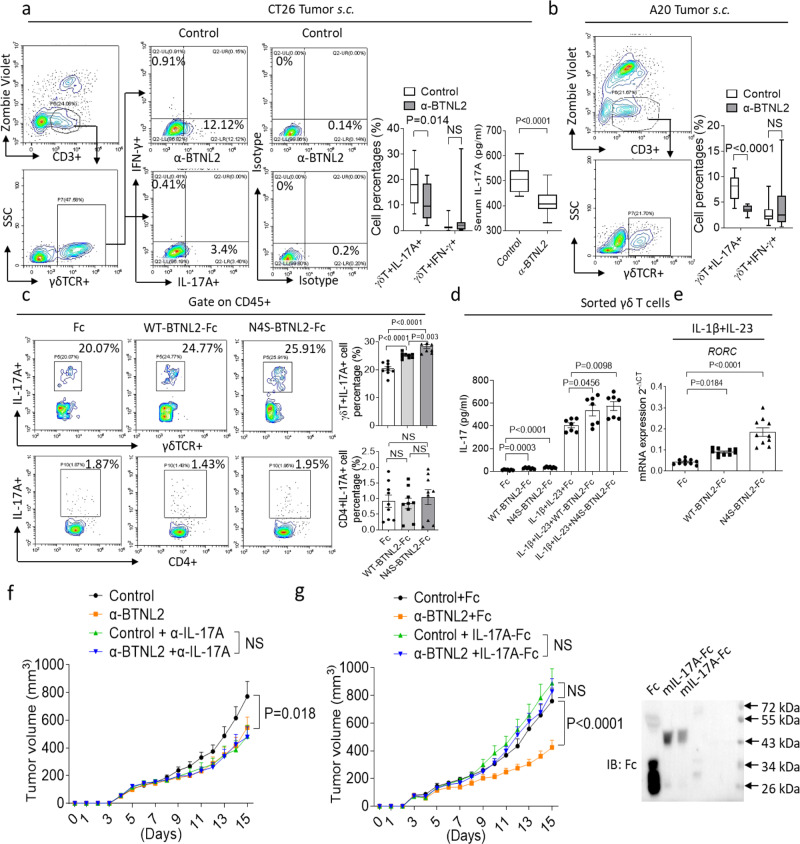
Fig. 2. Anti-BTNL2 mAb treatment decreases the tumour infiltration of γδT17 cells.
a, b After isotype control Ab or anti-BTNL2 mAb treatment (200 μg/mouse), infiltrated live CD3 + γδ T lymphocytes which producing IL-17A or IFN-γ in subcutaneous CT26 (a) and A20 (b) tumours were analyzed by flow cytometry as indicated (a, n = 15, P = 0.014 for γδT+IL-17A+ cell Percentages, NS for γδT+IFN-γ+ cell Percentages and b, n = 14, P < 0.0001 for γδT+IL-17A+ cell Percentages, NS for γδT+IFN-γ+ cell Percentages). Serum IL-17A was examined by ELISA (n = 15, P < 0.0001 for a). c Splenocytes were cultured in the presence of plate-coated Fc, WT-BTNL2-Fc or N4S-BTNL2-Fc recombinant proteins (10 μg/ml) for 48 h, followed by flow cytometry analysis of γδT17 and Th17 (cells were restimulated with Cell Activation Cocktail (with Brefeldin A) for 4 h, and were gated by live CD45+, n = 9, P < 0.0001 for Fc vs WT-BTNL2-Fc γδT+IL-17A+ cell Percentages, P < 0.0001 for Fc vs N4S-BTNL2-Fc γδT+IL-17A+ cell Percentages, P = 0.003 for WT-BTNL2-Fc vs N4S-BTNL2-Fc γδT+IL-17A+ cell Percentages, NS for CD4+IL-17A+ cell Percentages). d FACS sorted γδ T cells were cultured in the presence of plate-coated Fc, WT-BTNL2-Fc or N4S-BTNL2-Fc with or without IL-1β and IL-23 for 24 h. ELISA was performed to analyze IL-17A production (n = 7, P = 0.0003 for Fc vs WT-BTNL2-Fc, P < 0.0001 for Fc vs N4S-BTNL2-Fc, P = 0.0456 for IL-1β + IL-23+Fc vs IL-1β + IL-23+WT-BTNL2-Fc, P = 0.0098 for IL-1β + IL-23+Fc vs IL-1β + IL-23 + N4S-BTNL2-Fc). e FACS sorted γδ T cells were cultured in the presence of plate-coated Fc, WT-BTNL2-Fc or N4S-BTNL2-Fc together with IL-1β and IL-23 for 24 h, followed by real-time PCR analysis of RORC expression (n = 10, P = 0.0184 for Fc vs WT-BTNL2-Fc, P < 0.0001 for Fc vs N4S-BTNL2-Fc). f IL-17A were neutralized by neutralizing antibody described in the Methods (100 μg/mouse), and CT26 tumour growth kinetics was shown (n = 16 for each group, P = 0.018). g Primary CT26 tumour growth kinetics of mice after intraperitoneal injection of control Ab or anti-BTNL2 mAb (200 μg/mouse) together with Fc or IL-17A-Fc recombinant proteins was shown. (n = 15 for each group, P < 0.0001). Fc or IL-17A-Fc recombinant proteins (5 μg/mouse) were intraperitoneal injected at day 1, 4, 7, 10 and 13 after tumour implantation. Right panel indicates the purified Fc and IL-17A-Fc recombinant proteins analyzed by western blot. All data are mean ± s.e.m. *P < 0.05, **P < 0.01, ***P < 0.001, ****P < 0.0001 based on Mann–Whitney test for (a, b), one-way ANOVA for (c–e) and Two-way ANOVA for (f, g). Data are representative of three independent experiments.

