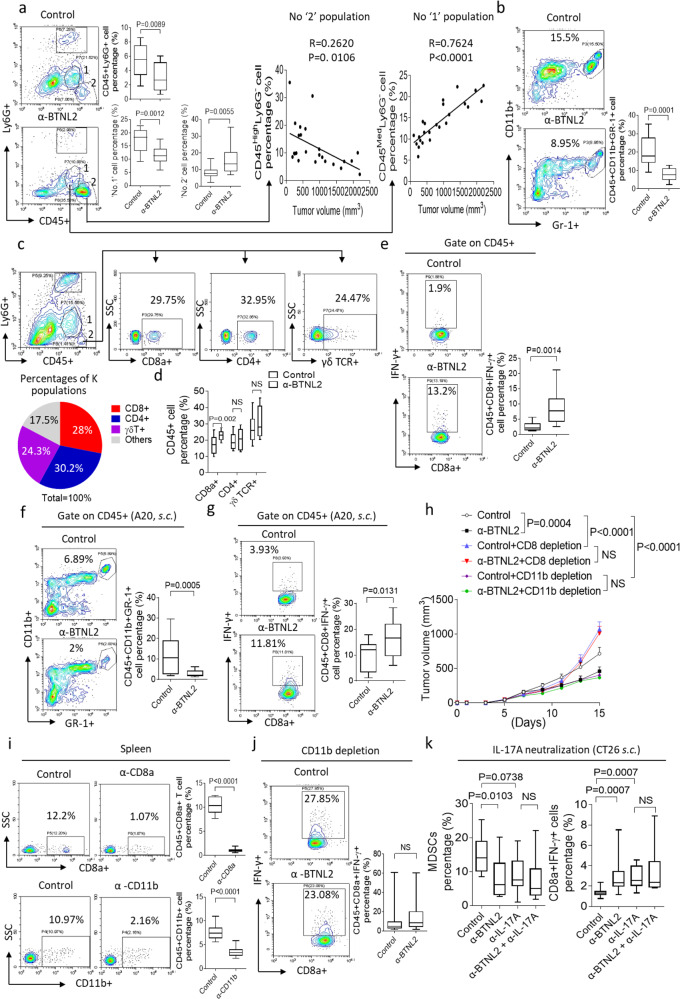
Fig. 4. Anti-BTNL2 mAb treatment decreases the tumour infiltration of MDSCs.
a–e After isotype control Ab or anti-BTNL2 mAb treatment (200 μg/mouse), infiltrated cells in subcutaneous CT26 tumours were analyzed by flow cytometry as indicated (a, n = 12, P = 0.0089 for CD45+Ly6G+ cell percentage, P = 0.0012 for ‘No. 1’ cell percentage, P = 0.0055 for ‘No. 2’ cell percentage; b, n = 12, P = 0.0001; d, n = 13, P = 0.002 for CD8α+, NS for CD4+ and γδ TCR+; e, n = 13, P = 0.0014). c ‘No. 2’ cell population was further gated by CD4+, CD8+ or γδ TCR+, and the percentages of different cell populations were shown. f, g After isotype control Ab or anti-BTNL2 mAb treatment (200 μg/mouse), A20 tumour-infiltrated cell were isolated, followed by flow cytometry analysis (n = 15, P = 0.0005 for f, and n = 13, P = 0.0131 for g). h CD8+ T cells or CD11b + cells were depleted by neutralizing antibody as described in the Materials and methods (100 μg/mouse of anti-CD8 or anti-CD11b mAb were used), and CT26 tumour growth kinetics of isotype control Ab or anti-BTNL2 mAb treatment were shown (n = 16 for each group, P = 0.004 for control vs α-BTNL2, P < 0.0001 for control vs control+CD8 depletion and control vs control + CD11b depletion, NS for control+CD8 depletion vs α-BTNL2 + CD8 depletion and control+CD11b depletion vs α-BTNL2 + CD11b depletion). i CD8 + T cells or CD11b + cells were depleted by neutralizing antibody (100 μg/mouse), and splenocytes were analyzed by flow cytometry for CD8 + T cells and CD11b + cells (n = 10 and 16, P < 0.0001). j After CD11b cells depletion and control Ab or anti-BTNL2 mAb treatment (100 μg/mouse of anti-CD11b mAb and 200 μg/mouse of anti-BTNL2 mAb were used), infiltrated cells in subcutaneous CT26 tumours were analyzed by flow cytometry as indicated (n = 13 for each group, NS for control vs α-BTNL2). k After IL-17A neutralization and isotype control Ab or anti-BTNL2 mAb treatment (100 μg/mouse of anti-IL-17A mAb and 200 μg/mouse of anti-BTNL2 mAb were used), infiltrated cells in subcutaneous CT26 tumours were analyzed by flow cytometry as indicated (n = 15 for each group, P = 0.0103 for control vs α-BTNL2 MDSCs percentage, P = 0.0738 for control vs α-IL-17A MDSCs percentage, NS for α-IL-17A vs α-BTNL2 + α-IL-17A MDSCs percentage, P = 0.0007 for control vs α-BTNL2 and control vs α-IL-17A CD8α+IFN-γ+ cells percentage, NS for α-IL-17A vs α-BTNL2 + α-IL-17A CD8α+IFN-γ+ cells percentage). All data are mean ± s.e.m. *P < 0.05, **P < 0.01, ***P < 0.001, ****P < 0.0001 based on two-way ANOVA for h, Dunn’s multiple comparisons test for k, two-sided Mann–Whitney test for j and two-sided unpaired t-test for a–e, f, g, i. Data are representative of three independent experiments.

