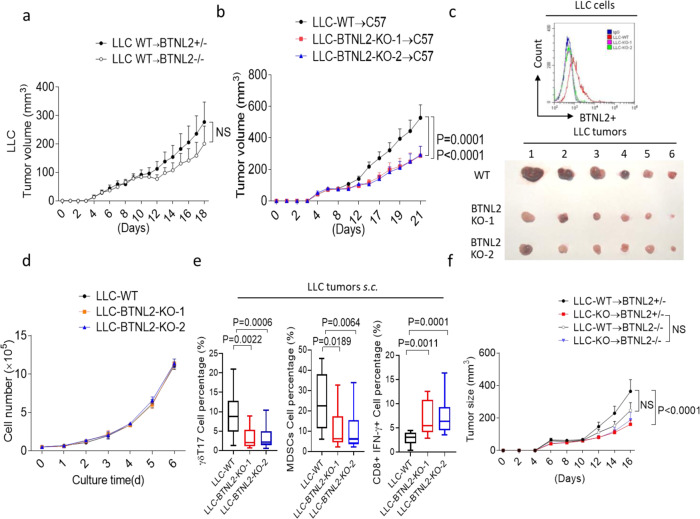
Fig. 5. Tumour-expressed BTNL2 plays a major role for the anti-tumour immune escaping.
a Littermate control mice or BTNL2-KO mice were implanted WT LLC cells, and tumour growth kinetics of mice was shown (n = 12 for each group). b WT LLC cells or two clones of BTNL2-KO LLC cells were implanted subcutaneously in WT mice (3 × 10⁵/mouse), and tumour growth kinetics was shown (n = 14 for each group, P = 0.0001 for LLC-WT vs LLC-BTNL2-KO-1 and P < 0.0001 for LLC-WT vs LLC-BTNL2-KO-2). c WT or BTNL2-KO LLC cells were analyzed by anti-BTNL2 mAb-2 for flow cytometry analysis (upper panel). Tumour image from b was shown (lower panel). d WT LLC cells or BTNL2-KO LLC cells were cultured in vitro for indicated times, and cell proliferation was shown by cell counting. e Cells from WT LLC tumours or BTNL2-KO LLC tumours were isolated, followed by the flow cytometry analysis (n = 14 for each group, P = 0.0022 for LLC-WT vs LLC-BTNL2-KO-1 γδT17 cell percentage and P = 0.0006 for LLC-WT vs LLC-BTNL2-KO-2 γδT17 cell percentage, P = 0.0189 for LLC-WT vs LLC-BTNL2-KO-1 MDSCs cell percentage and P = 0.0064 for LLC-WT vs LLC-BTNL2-KO-2 MDSCs cell percentage, P = 0.0011 for LLC-WT vs LLC-BTNL2-KO-1 CD8α+IFN-γ+ cells percentage and P = 0.0001 for LLC-WT vs LLC-BTNL2-KO-2 CD8α+IFN-γ+ cells percentage). f Littermate control mice or BTNL2-KO mice were implanted with WT or BTNL2-KO LLC cells, and tumour growth kinetics of mice was shown (n = 12 for each group, P < 0.0001 for control mice were implanted with WT vs BTNL2-KO LLC cells, NS for control mice or BTNL2-KO mice were implanted with BTNL2-KO LLC cells and control mice or BTNL2-KO mice were implanted with WT LLC cells). All data are mean ± s.e.m. *P < 0.05, **P < 0.01, ***P < 0.001, ****P < 0.0001 based on two-way ANOVA for a, b, d, f, and Dunn’s multiple comparisons test for e. Data are representative of three independent experiments.

