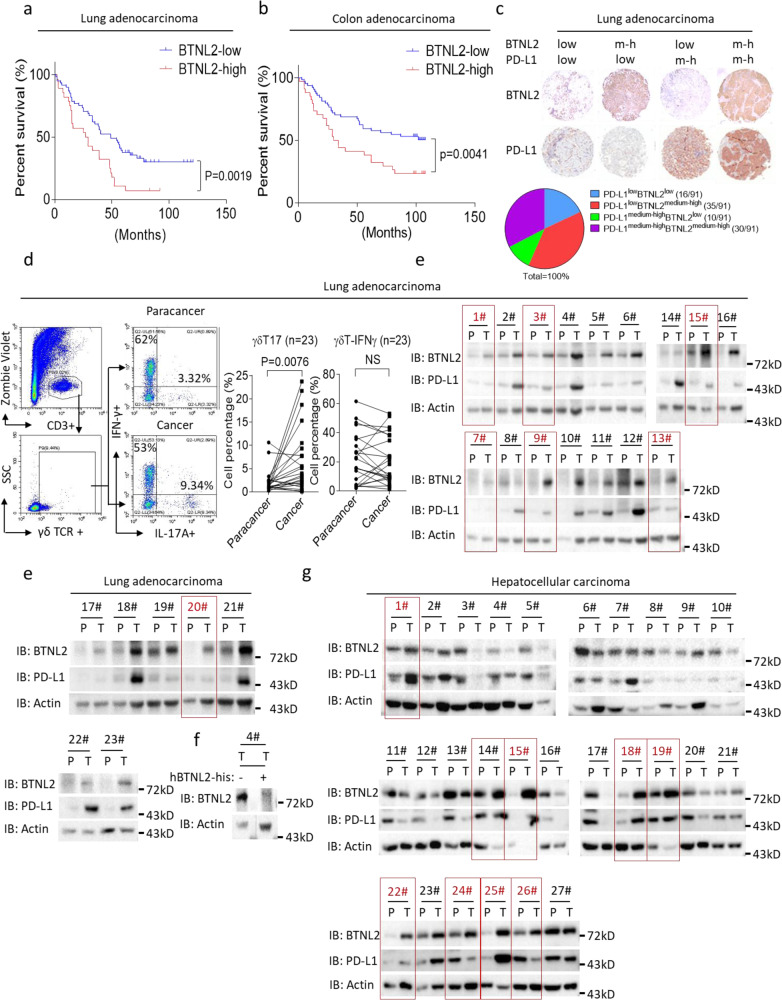
Fig. 6. BTNL2 expression in human cancers correlates with patient’s prognosis.
a, b Kaplan–Meier estimates of overall survival of lung adenocarcinoma (a) and colon adenocarcinoma patients b based on the expression level of BTNL2 (n = 91 for a and n = 99 for b). Comparison was made of groups with high BTNL2 expression (score ≥ 9) and low BTNL2 expression (score < 9) according to immunohistochemistry scoring system described in the Materials and methods. c The percentages of lung adenocarcinoma samples with different expression patterns of BTNL2 and PD-L1 were shown, and score ≥ 5 was considered medium to high expression, and score ≤ 4 was considered low expression. ‘m-h’ indicates medium to high expression level of BTNL2. d Cells were isolated from lung adenocarcinoma samples and para-cancerous samples (n = 23), and were stained as indicated for flow cytometry analysis. e Lysates from 23 pairs of cancer samples and para-cancerous samples from lung adenocarcinoma patients were analyzed by western blot, and probed for indicated proteins. The samples number with higher expression of BTNL2 but low expression of PD-L1 was marked as red. f The BTNL2 Ab which incubated with or without recombinant His-hBTNL2 proteins was probed with the cancer sample from no.4 patient, and western blot of BTNL2 was shown (lower panel). g Lysates from 27 pairs of cancer samples and para-cancerous samples from hepatocellular carcinoma patients were analyzed by western blot, and probed for indicated proteins. The samples numbers with higher expression of BTNL2 was marked as red. All data are mean ± s.e.m. *P < 0.05, **P < 0.01, ***P < 0.001, ****P < 0.0001 based on Log-rank (Mantel-Cox) test for a and b and two-sided Mann–Whitney test for d. Data in e–g are representative of three independent experiments.

