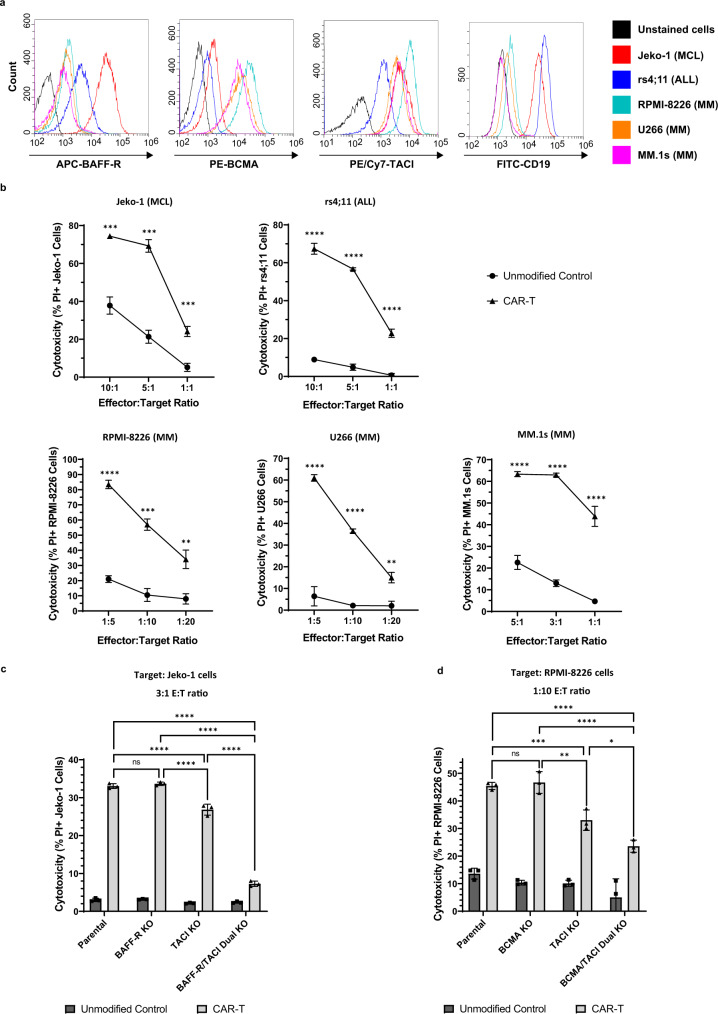
Fig. 4. BAFF CAR-T cells display significant in vitro cytotoxicity towards MCL, ALL, and MM cells.
a Cell lines of different B cell malignancies were stained for BAFF-R, BCMA, TACI, and CD19 expression. Red = Jeko-1 (MCL); blue = rs4;11 (ALL); cyan = RPMI-8226 (MM); orange = U266 (MM); purple = MM.1s (MM); black = unstained cells. b CAR-T cells or unmodified T cells were co-cultured with fluorescently-labeled cancer cells at indicated E:T ratios for 16 h (Jeko-1, rs4;11, MM.1s) or 40 h (RPMI-8226, U266). Cytotoxicity was measured via PI staining and gating on labeled target cells. Circle = Unmodified Control, triangle = CAR-T. **P < 0.01, ***P < 0.001, ****P < 0.0001. Jeko-1: P = 3.34e-4 (10:1), P = 1.92e-4 (5:1), P = 6.72e-4 (1:1). rs4;11: P = 9e-6 (10:1), P = 3e-6 (5:1), P = 8.8e-5 (1:1). RPMI-8226: P = 2.1e-5 (1:5), P = 2.85e-4 (1:10), P = 2.919e-3 (1:20). U266: P = 7.2e-5 (1:5), P = 3e-6 (1:10), P = 2.179e-3 (1:20). MM.1s: P = 6.6e-5 (5:1), P = 3e-6 (3:1), P = 1.29e-4 (1:1). Mean ± SD, n = 3 biologically independent co-cultures, multiple unpaired two-tailed t-tests with Holm-Šídák correction for multiple comparisons. c CRISPR was used to knock out expression of either BAFF-R, TACI, or both BAFF-R and TACI in Jeko-1 cells. Fluorescently-labeled cancer cells were co-cultured with BAFF CAR-T cells or unmodified T cells 16 h at 3:1 E:T ratio. Parental Jeko-1 cells served as negative control. Cytotoxicity was measured as above. ns not significant, ****P < 0.0001. Mean ± SD, n = 3 biologically independent co-cultures, two-way ANOVA with Tukey’s multiple comparisons test. d CRISPR was used to knock out expression of either BCMA, TACI, or both BCMA and TACI in RPMI-8226 cells. Fluorescently-labeled cancer cells were co-cultured with BAFF CAR-T cells or unmodified T cells 36 h at 1:10 E:T ratio. Parental RPMI-8226 cells served as negative control. Cytotoxicity was measured as above. ns not significant, *P < 0.05, **P < 0.01, ***P < 0.001, ****P < 0.0001. P = 0.0015 (Parental vs TACI KO), P < 0.0001 (Parental vs BCMA/TACI Dual KO), P = 0.0006 (BCMA KO vs TACI KO), P < 0.0001 (BCMA KO vs BCMA/TACI Dual KO), P = 0.0137 (TACI KO vs BCMA/TACI Dual KO). Mean ± SD, n = 3 biologically independent co-cultures, two-way ANOVA with Tukey’s multiple comparisons test. Source data for all graphs are provided as a Source Data file. All cytotoxicity experiments were repeated with two different T cell donors.

