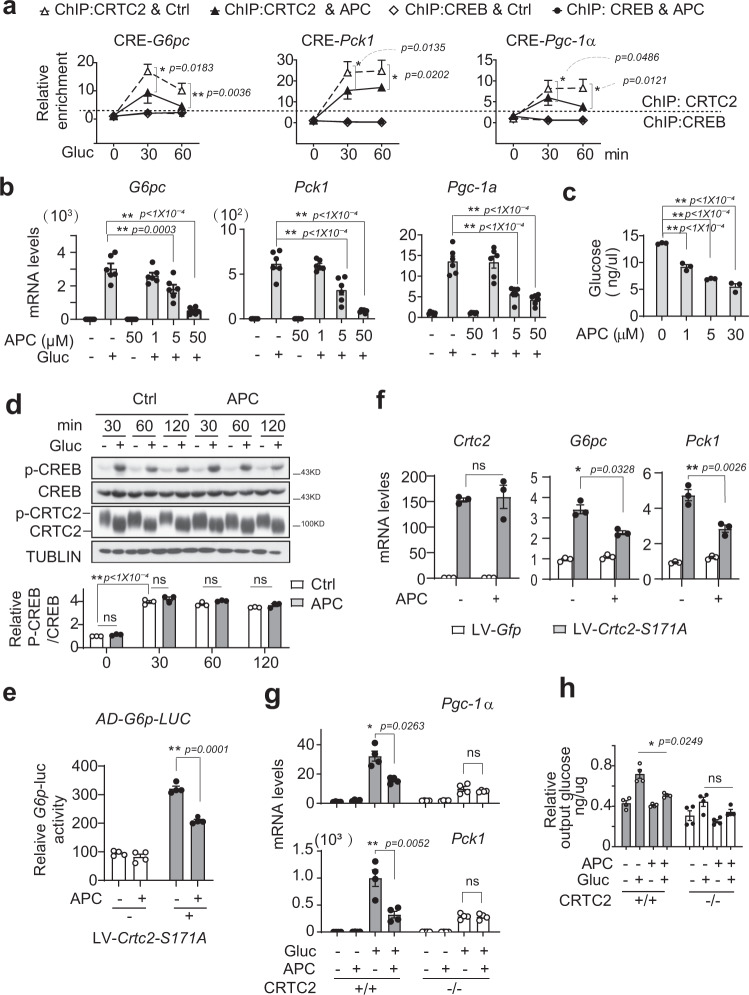
Fig. 4. Gluconeogenic transcription inhibited by APC.
a ChIP assay of CRTC2 and CREB recruited to the CRE sites in the promoters of G6pc, Pck1, and Pgc-1α in primary mouse hepatocytes overexpressing HA-CRTC2. Pretreatment with APC (10 μM) for 1-h prior to stimulation by glucagon (Gluc, 100 nM) for indicated times (n = 4 per treatment). One of three independent experiments is presented here. *P < 0.05; **P < 0.01; P values were determined by two-way ANOVA followed Bonferroni’s multiple comparisons test. b Quantitative PCR analysis of G6pc, Pck1, and Pgc-1α gene expression in primary hepatocytes treated with vehicle or APC (1, 5, or 50 μM) for 1-h prior to 4-h stimulation with glucagon (100 nM, n = 3 per treatment). One of three independent experiments is presented here. Data are represented as mean ± SEM. *P < 0.05; **P < 0.01; P values were determined by one-way ANOVA followed Dunnett’s multiple comparisons test. c Glucose output from primary hepatocytes pretreated with APC (1, 5, or 30 μM) for 1-h prior to 8-h stimulation by glucagon (100 nM, n = 3 per treatment). One of three independent experiments is presented here. Data are represented as mean ± SEM. *P < 0.05; **P < 0.01; P values were determined by one-way ANOVA followed Dunnett’s multiple comparisons test. d Immunoblotting analysis of phosphorylated CREB and dephosphorylated CRTC2 protein in primary hepatocytes exposed to APC (10 μM) for 1-h before stimulation by glucagon (100 nM) for indicated times (30, 60, or 120 min). One of three independent experiments (top) is presented here and the relative density of P-CREB is normalized to CREB and is shown as a bar graph (bottom, n = 3 per treatment). One of three independent experiments is presented here. Data are represented as mean ± SEM. ns, P > 0.05; *P < 0.05; **P < 0.01; P values were determined by two-way ANOVA followed Bonferroni’s multiple comparisons test. e Luciferase G6p-Luc activity. Primary hepatocytes were infected by lentivirus LV-Crtc2-S171A as well as AD-G6p-luc and AD-RSV-ß-Gal for 24-h, then incubated with APC (10 μM) for 8-h before luciferase assay (n = 4 per treatment). One of three independent experiments is presented here. Data are represented as mean ± SEM. *P < 0.05; **P < 0.01; P values were determined by two-way ANOVA followed Bonferroni’s multiple comparisons test. f Quantitative PCR analysis of Crtc2, Pgc-1α, and Pck1 gene expression in primary hepatocytes. Infected by lentivirus, Crtc2-S171A or Gfp were expressed in primary hepatocytes isolated from wild-type C57 mice for 72-h, followed by incubation with APC (10 μM) for 8-h before RNA isolation (n = 3 per treatment). One of three independent experiments is presented here. Data are represented as mean ± SEM. *P < 0.05; **P < 0.01; P values were determined by two-way ANOVA followed Bonferroni’s multiple comparisons test. g Quantitative PCR analysis of Pgc-1α and Pck1 gene expression in primary wild-type or CRTC2-null hepatocytes exposed to APC (10 μM) for 1-h prior to 4-h stimulation with glucagon (100 nM, n = 4 per treatment). One of three independent experiments is presented here. Data are represented as mean ± SEM. *P < 0.05; **P < 0.01; P values were determined by two-way ANOVA followed Bonferroni’s multiple comparisons test. h Glucose output from wild-type or CRTC2-null primary hepatocytes exposed to APC (10 μM) for 1-h prior to 6-h stimulation by glucagon (100 nM). One of three independent experiments is presented here. Relative output glucose level normalized by protein content of assay media. Data are represented as mean ± SEM (n = 4 per treatment). ns, P > 0.05; *P < 0.05; **P < 0.01; P values were determined by two-way ANOVA followed Bonferroni’s multiple comparisons test. Source data for this figure are provided as source data file.

