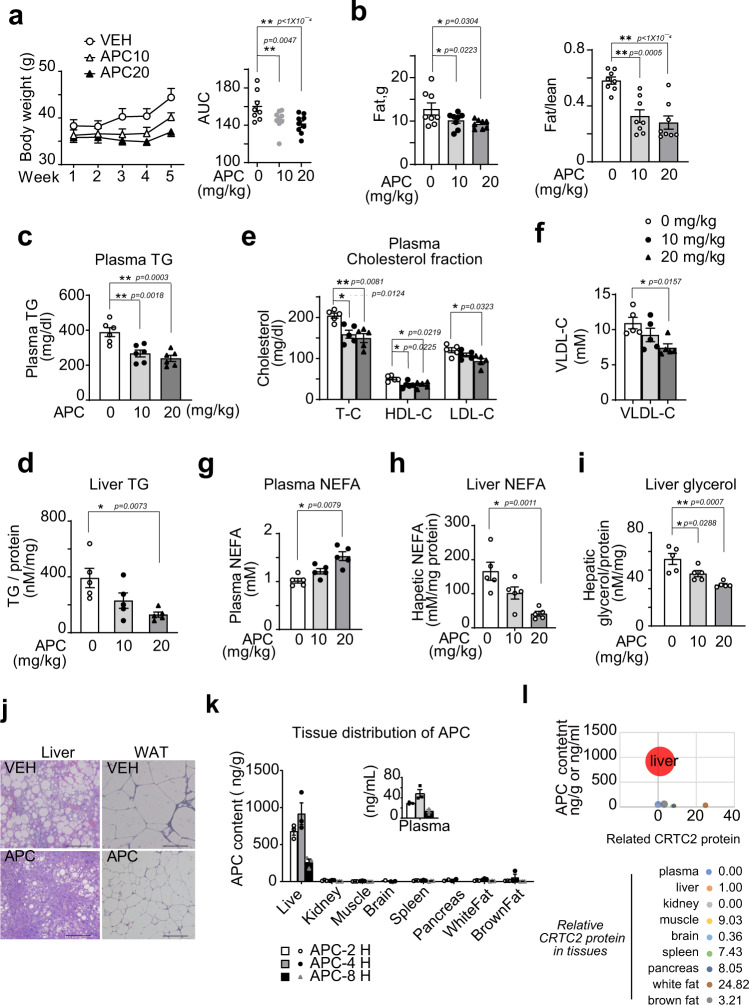
Fig. 5. APC improves hyperlipidemia of obese mice.
DIO mice were continuously i.p. injected with control vehicle or APC with indicated doses (APC, 0, 10, and 20 mg/kg) or vehicle (Ctrl) one time daily for 5 weeks (n = 5–9). a Body-weight curves of these mice (left). Area under curve (AUC) analysis of curves is shown as a scatter chart at the right. Data are represented as mean ± SEM (n = 8–9 per group). *P < 0.05; **P < 0.01; P values were determined by two-way ANOVA followed Bonferroni’s multiple comparisons test in curve analysis, or by using one-way ANOVA followed Dunnett’s multiple comparisons test in AUC analysis. b In vivo NMR analysis of whole-body fat mass (left) and fat composition (right, fat/lean ratio) of these mice (n = 8 per group). Data are represented as mean ± SEM. *P < 0.05; **P < 0.01; P values were determined by one-way ANOVA followed Dunnett’s multiple comparisons test. The triglyceride (TG) contents in the serum (c) and liver (d) of these mice. The contents of (e) total cholesterol (TC), LDL cholesterol (LDL-C), and HDL cholesterol (HDL-C), (f) VLDL-C, and (g) nonesterified fatty acid (NEFA) in the serum of these mice. h The contents of hepatic NEFA and (i) glycerol in these mice, which were normalized by hepatic protein levels as determined by BCA assay. Data are represented as mean ± SEM (n = 5–6). *P < 0.05; **P < 0.01; P values were determined by one-way ANOVA followed Dunnett’s multiple comparisons test. j Histological analysis of liver and epididymis fat (WAT) from DIO mice treated with APC (20 mg/kg) or vehicle for 5 weeks. Tissues were stained with hematoxylin and eosin. Scale bars represent 100 μm. Here is shown one present result from three independent experiments. k The tissue distribution of APC in vivo (n = 3 per group, data are represented as mean ± SEM). Two to 8-h after one oral dose (20 mg/kg), the APC content in indicated tissues of C57BL6 was detected by a liquid chromatography-mass spectrometry/mass spectrometry (LC–MS/MS) and normalized by protein concentration. l Combination analysis of APC concentration and relative CRTC2 protein level in tissues. Taking the APC concentration (4-h after p.o.) as the Y axis, the relative content of CRTC2 as the X axis, and the APC content as the size of bubbles, each tissue was projected on the graph (top). The relative density of CRTC2 protein of indicated tissues was corrected to TUBULIN and normalized with that in the liver (as base) (bottom, and associated with Supplementary Fig. 4h). Source data for this figure are provided as source data file.

