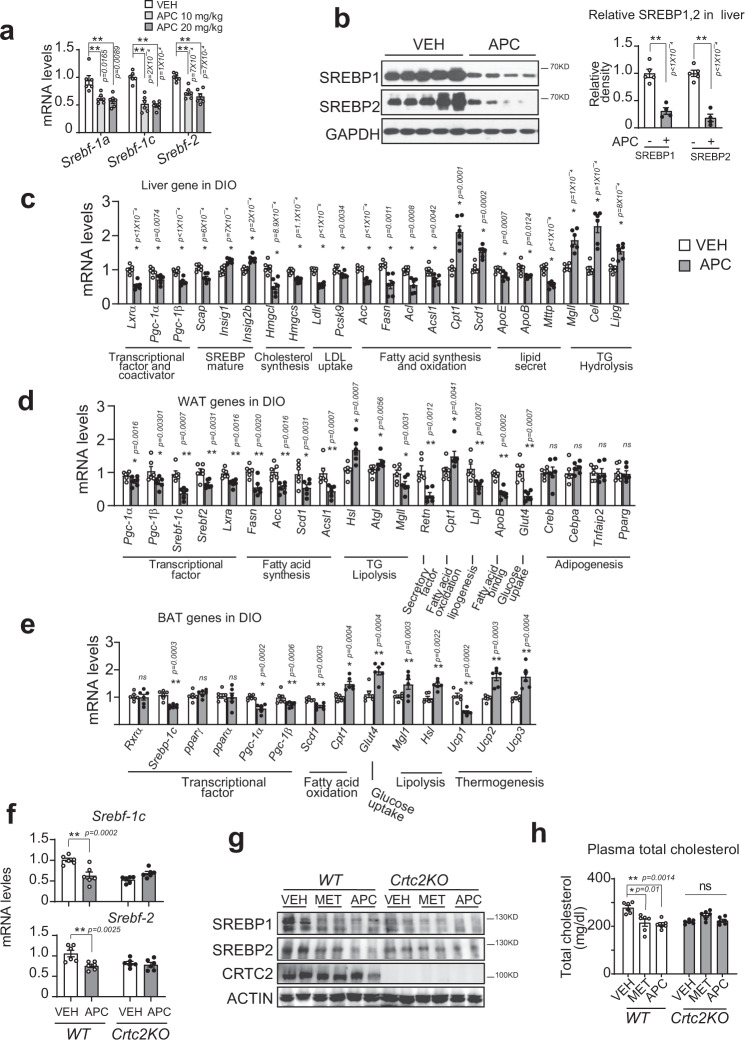
Fig. 6. SREBPs-mediated lipid metabolism is reduced by APC.
DIO mice were continuously i.p. injected with control vehicle (VEH) or artepillin C (APC) at indicated dose one time daily for 5 weeks (n = 5–7). a Quantitative PCR analysis of hepatic expressions of Srebf-1a, -1c, and 2 in these animals. Data are represented as mean ± SEM (n = 6 per group). *P < 0.05; **P < 0.01; P values were determined by one-way ANOVA followed Dunnett’s multiple comparisons test. b Immunoblotting analysis of hepatic SREBP-1c and 2 protein levels in these animals. One representative result from three independent experiments is shown (left), and relative SREBP1, and SREBP2 in the liver of these animals is normalized to GAPDH and is presented as a bar graph (right). Data are represented as mean ± SEM (n = 6 per group). *P < 0.05; **P < 0.01; P values were determined by one-way ANOVA followed Dunnett’s multiple comparisons test. c Quantitative PCR analysis of mRNA levels of genes related to lipid metabolism in the liver, (d) white adipose tissue (WTA), and (e) brown adipose tissue (BAT). Data are represented as mean ± SEM (n = 6). ns, P > 0.05; *P < 0.05; **P < 0.01; P values were determined by unpaired two-tailed multiple t test with two-stage linear step-up procedure, each gene was analyzed individually, without assuming a consistent SD. f Quantitative PCR analysis of mRNA levels of Srebp-1c and Srebp-2 in the liver of Crtc2-KO mice and wild-type littermates (n = 6) fed with high-fat diet for 8 weeks. These animals were then orally administered with either vehicle control (VEH), or APC (20 mg/kg) one time daily for 3 weeks, followed by 8-h fasting before being sacrificed. One of two independent experiments is presented here. Data are represented as mean ± SEM. *P < 0.05; **P < 0.01; P values were determined by the two-way ANOVA followed Bonferroni’s multiple comparisons test. g SREBP1 and SREBP2 protein in the liver of Crtc2-KO mice (n = 5 mice per group, two technological repeats present a composite pool) as (f), and metformin (MET, 200 mg/kg) as a positive control. One of two independent experiments presented here, and relative SREBP1 and SREBP2 in the liver is shown as a bar graph (Supplementary Fig. 5a). h The plasma cholesterol of Crtc2-KO mice treated with MET and APC as (g). Data are represented as mean ± SEM (n = 6 per group). ns, P > 0.05; *P < 0.05; **P < 0.01; P values were determined by two-way ANOVA followed Bonferroni’s multiple comparisons test. Source data for this figure are provided as source data file.

