
Fig. 4. Adjusting for covariates provided to DeepNull during association testing is necessary to avoid bias.
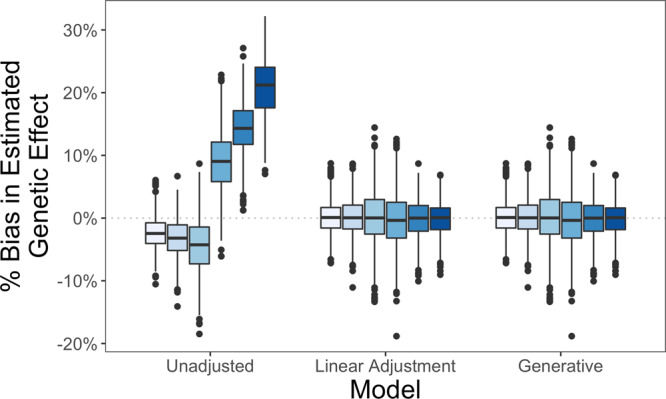
The unadjusted model regresses yi on and h(xi), the prediction of yi based on xi, omitting xi from the association model. This approach results in biased estimation of the genetic effect. The linear adjustment model regresses yi on , xi, and h(xi). This approach is unbiased. The generative model regresses yi on , xi, and . This represents the best possible performance. Each box plot summarizes results from n = 103 independent simulation replicates. The box demarcates, from top to bottom, the 75th, 50th, and 25th percentiles of the corresponding distribution. The whiskers extend between the largest and smallest values within 1.5 times the interquartile range. Any values outside the whiskers are marked by points. Source data are provided as a Source Data file.