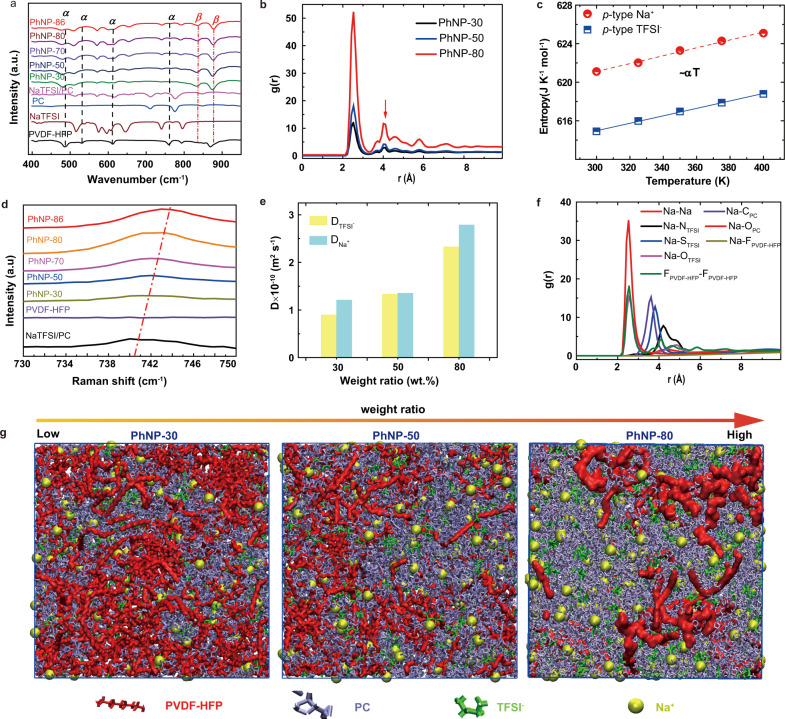
Fig. 2. The structural characterization and atomic-level interaction in PhNPs.
a FTIR spectra with a range of 400–950 cm−1, b the calculated RDFs of the PhNP-30, -50 and -80 samples, c the calculated entropy change of cations and anions in PhNP-86, d the Raman spectra with a range of 733–746 cm−1 of each PhNPs, e the diffusion coefficient of Na+ and TFSI− in PhNP-30, -50 and -80 samples, f the RDF of each interaction among ions and PVDF-HFP of PhNP-50 and g the snapshots of the PhNP-30, -50 and -80 samples in the MD simulation model.

