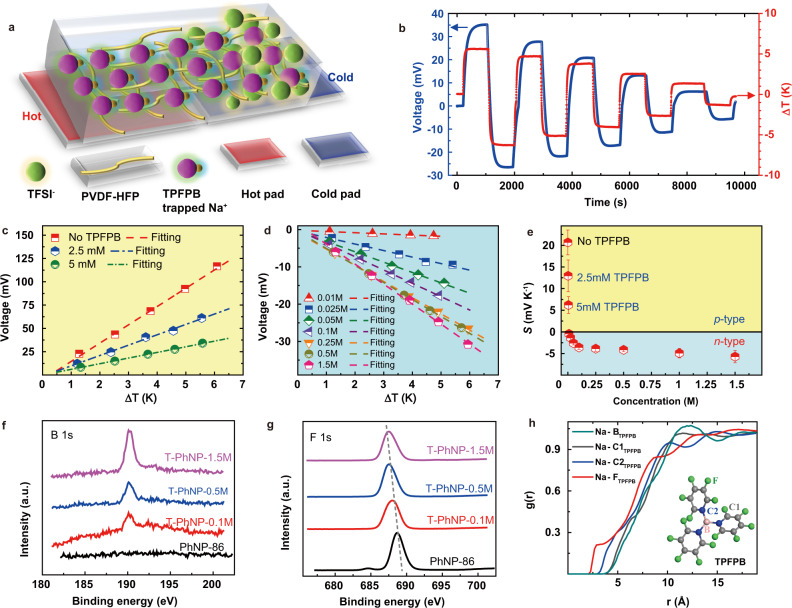
Fig. 3. The conversion from p-type PhNP to n-type T-PhNP.
a The schematic of ion transport of n-type (TFSI− anions dominate thermodiffusion) T-PhNP i-TE materials. b The generated voltage under a series of temperature differences of T-PhNP-1.5 M. c, d The plot of fitting curves of ΔVi-ΔT and e the calculated thermopower of each T-PhNPs. XPS characterization of f B (1 s) and g F (1 s) peak of T-PhNPs. h The radial distribution function of Na+ cations and the atoms of TPFPB molecules.

