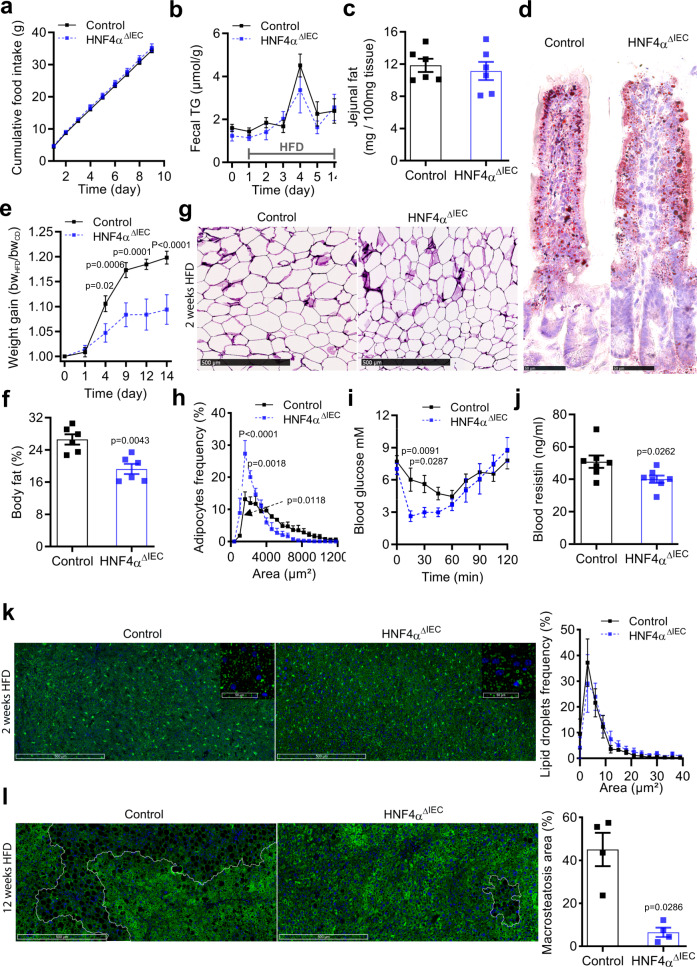
Fig. 2. Loss of intestinal epithelial HNF4A improves metabolic fitness during both short and long-term HFD exposure.
a Cumulative food intake monitored in metabolic cages for 9 consecutive days for both adult control (black squares) and HNF4AΔIEC mutant (blue squares) mice fed a HFD (n = 5). Statistical comparisons were performed using two-way ANOVA followed by uncorrected Fisher’s LSD test. b Triglyceride levels in fecal lipid extracts measured using colorimetry in control (black squares) and HNF4AΔIEC mutant (blue squares) mice fed a HFD (n = 6). Statistical comparisons were performed using two-way ANOVA followed by uncorrected Fisher’s LSD test. c Raw fat mass extracted from jejunum tissues of control (black squares) and HNF4AΔIEC mutant (blue squares) mice fed a HFD for 2 weeks (n = 6). Statistical comparisons were performed using two-tailed Mann–Whitney test. d Representative jejunum villi stained with Oil Red O (ORO) from control and HNF4AΔIEC mutant mice fed a HFD for 2 weeks (n = 3). e Weight gain ratios of control (black squares) and HNF4AΔIEC mutant (blue squares) mice fed a HFD for 2 weeks (n = 6). Statistical comparisons were performed using two-way ANOVA followed by uncorrected Fisher’s LSD test. f Percentage of total body fat of control (black squares) and HNF4AΔIEC mutant (blue squares) mice fed a HFD for 2 weeks, from DXA analysis (n = 6). Statistical comparisons were performed using two-tailed Mann–Whitney test. eWAT histological sections (g) and histomorphometric analysis (h) from controls (black squares; n = 4) and HNF4AΔIEC mutant (blue squares; n = 3) mice fed a HFD for 2 weeks (three sections analyzed per sample). Statistical comparisons were performed using two-way ANOVA followed by uncorrected Fisher’s LSD test. i Insulin tolerance test (ITT) performed on control (black squares; n = 9) and HNF4AΔIEC mutant (blue squares; n = 5) mice fed a HFD for 2 weeks. Statistical comparisons were performed using two-way ANOVA followed by uncorrected Fisher’s LSD test. j Blood resistin levels measured using ELISA in control (black squares) and HNF4AΔIEC mutant (blue squares) mice fed a HFD for 2 weeks (n = 7). Statistical comparisons were performed using two-tailed Mann–Whitney test. k–l Representative hepatic sections revealing lipid droplets (LDs) immunostained for ADFP (green) and counterstained with DAPI. k Homogeneity of hepatic LDs and size analysis for control (black squares) and HNF4AΔIEC mutant (blue squares) mice fed a HFD for 2 weeks (n = 4). Statistical comparisons were performed using two-way ANOVA followed by uncorrected Fisher’s LSD test. l Heterogeneity of hepatic LD size and occurrence in areas of macrosteatosis (white circles) calculated for control (black squares) and HNF4AΔIEC mutant (blue squares) mice fed a HFD for 12 weeks (n = 4). Statistical comparisons were performed using two-tailed Mann–Whitney test. Data are presented as mean values ± SEM. Source data are provided as a Source Data file.

