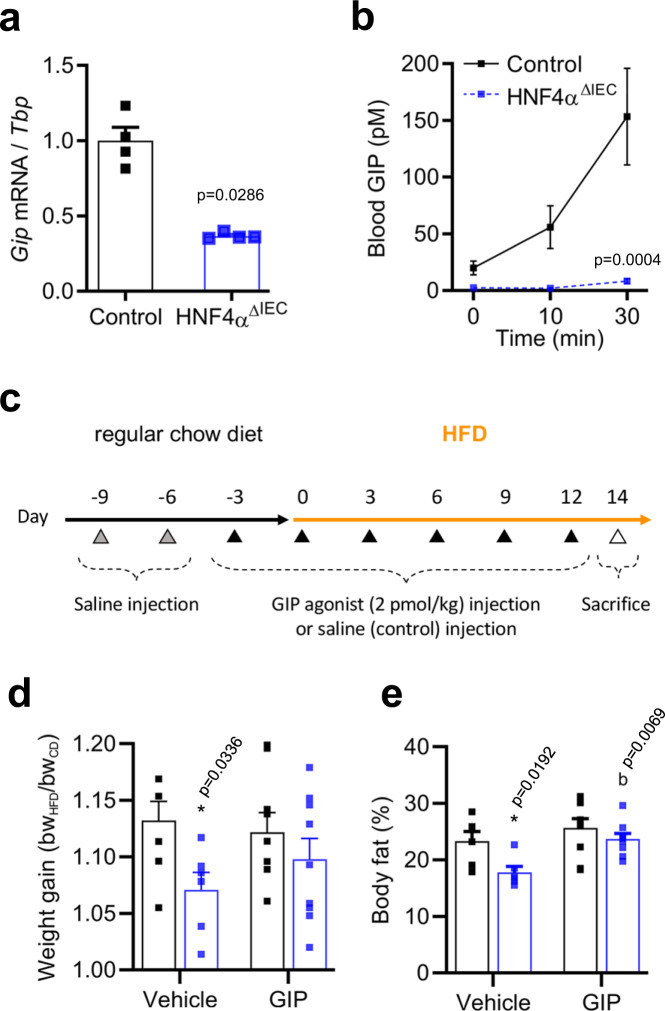
Fig. 5. GIP analog exposure rescues the DIO resistance phenotype of HNF4AΔIEC mutants.
a Gip transcript expression relative to Tbp in the jejunum of HFD fed control (black squares) and HNF4AΔIEC mutant (blue squares) mice (n = 4). Statistical comparisons were performed using two-tailed Mann–Whitney test. b Circulating GIP levels were determined using ELISA after OFTT in HFD fed control (black squares; n = 8) and HNF4AΔIEC mutant (blue squares; n = 5) mice. Statistical comparisons were performed using the two-way ANOVA followed by uncorrected Fisher’s LSD test. c Protocol timeline of HFD feeding and (D-Ala2)GIP[Lys37PAL] injections in both control and HNF4AΔIEC mutant mice. Weight gain (d) and body fat amount (e) of control (black squares) and HNF4AΔIEC mutant mice (blue squares) injected with saline (n = 7 for controls and n = 6 for mutants) or (D-Ala2)GIP[Lys37PAL] (n = 9 for both controls and mutants) at 2 pmol/kg and fed a HFD for 2 weeks. Statistical comparisons were performed using the two-way ANOVA followed by uncorrected Fisher’s LSD test. Asterisk indicates comparison versus control and mutant mice from the saline group, and b indicates comparison versus mutant mice from the saline and the GIP analog group. Data are presented as mean values ± SEM. Source data are provided as a Source Data file.

