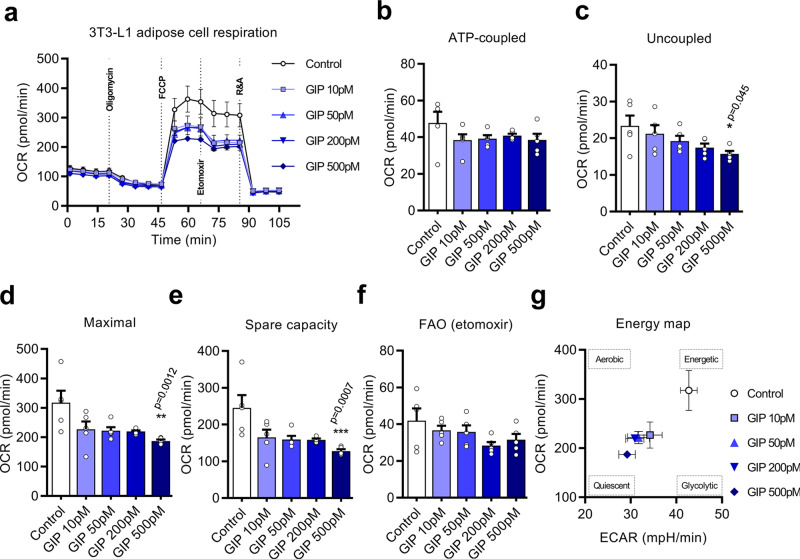
Fig. 6. GIP analog exposure reduces metabolic rates of differentiated 3T3-L1 white adipocytes.
a Seahorse oxygen consumption rate (OCR) data acquisition of differentiated 3T3-L1 cells exposed to gradient doses of (D-Ala2)GIP[Lys37PAL] (control: white circles, 10 pM: lavender blue squares, 50 pM: light blue triangles, 200 pM: blue inverted triangles, 500 pM: dark blue diamonds) (n = 5 biological independent samples over two independent experiments). ATP-coupled (b), uncoupled (c), maximal (d), spare capacity (e), and dedicated fatty-acid oxidation (FAO) (f) respiration parameters of differentiated 3T3-L1 cells exposed to (D-Ala2)GIP[Lys37PAL] during mitochondrial stress tests (n = 5 biological independent samples over two independent experiments, control: white columns, 10 pM: lavender blue columns, 50 pM: light blue columns, 200 pM: blue columns, 500 pM: dark blue columns). g Incidence of (D-Ala2)GIP[Lys37PAL] exposures upon metabolic performances of 3T3-L1 differentiated adipocytes (control: white circles, 10 pM: lavender blue squares, 50 pM: light blue triangles, 200 pM: blue inverted triangles, 500 pM: dark blue diamonds). Scatter plot of OCR against extracellular acidification rate (ECAR) as determined during the maximal mitochondrial respiration phase (n = 5 biological independent samples over two independent experiments). Statistical comparisons for all panels were performed using Kruskal–Wallis followed by Dunn’s test. Data are presented as mean values ± SEM. Source data are provided as a Source Data file.

