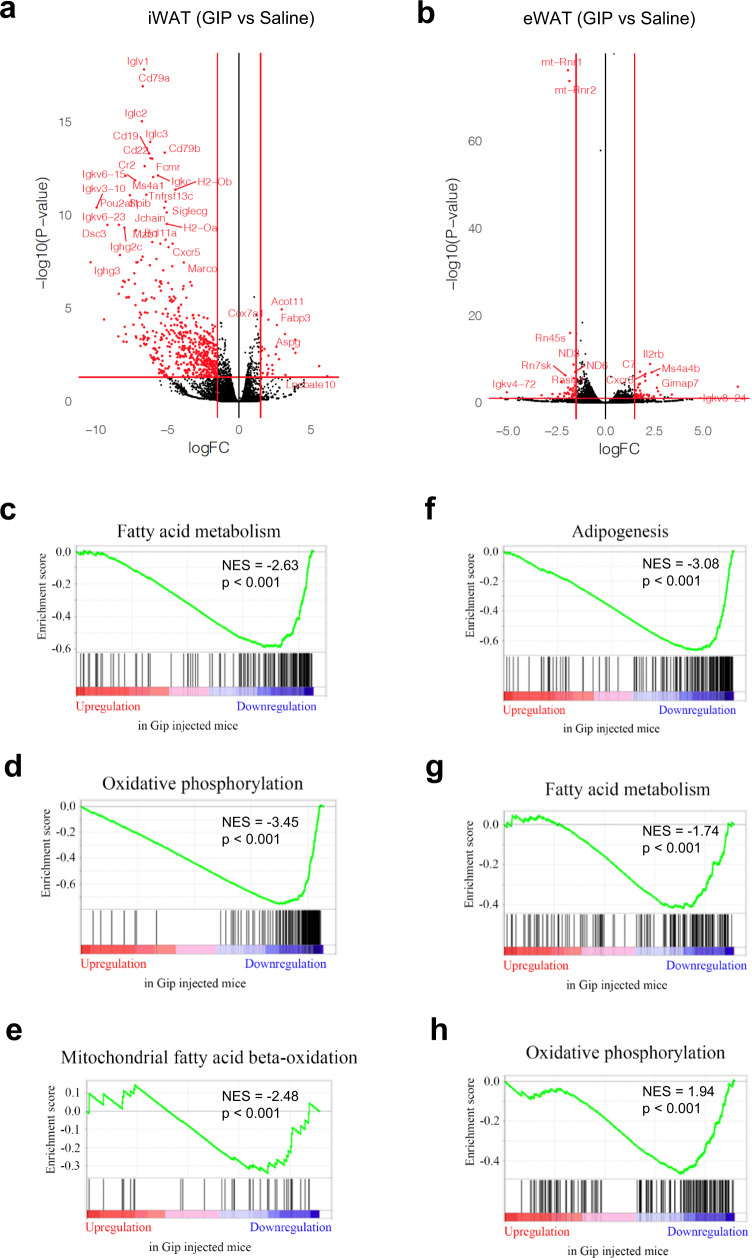
Fig. 7. GIP analog exposure influences WAT transcriptome in mice fed a HFD.
Volcano plots of differential gene expression obtained from RNA-seq of iWAT (a) and eWAT (b) after GIP analog exposure. iWAT RNA-seq data were analyzed using GSEA to evaluate changes in fatty-acid metabolism (c), oxidative phosphorylation (d), mitochondrial fatty-acid beta-oxidation (e) and adipogenesis (f). eWAT RNA-seq data were also analyzed for changes in fatty-acid metabolism (g) and oxidative phosphorylation (h). NES (normalized enrichment score) and nominal p value are depicted.

