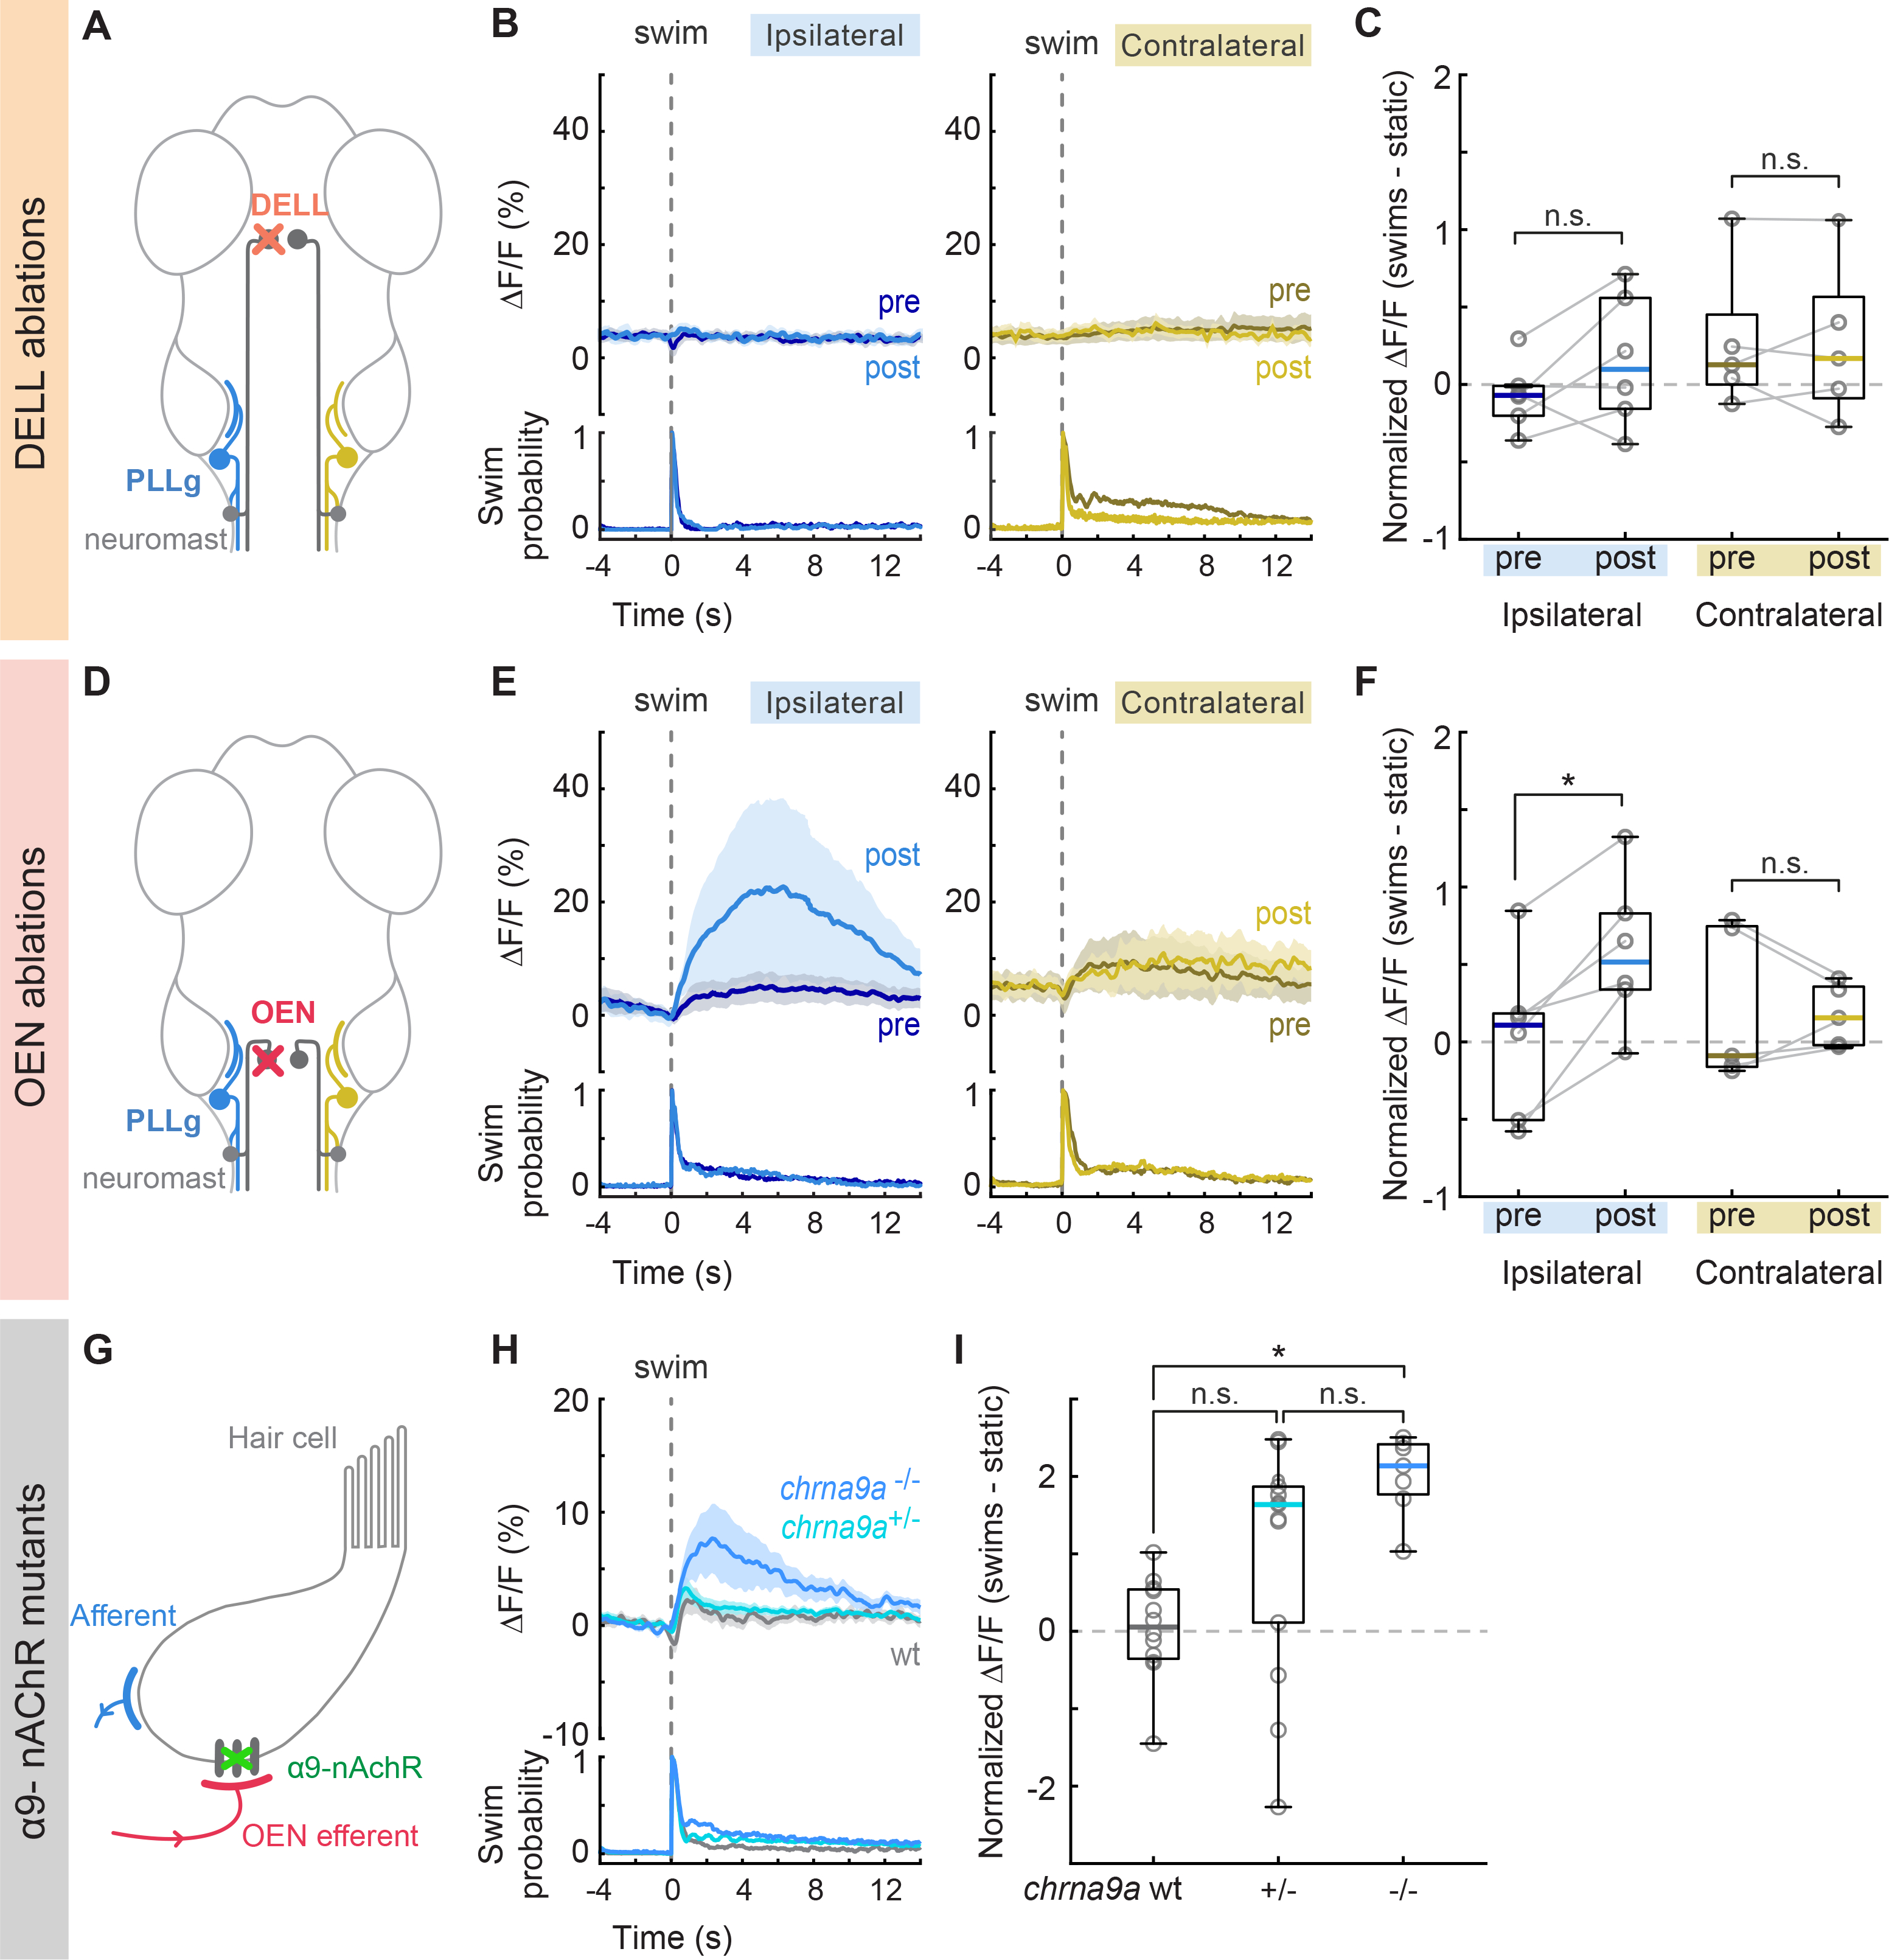
Figure 5. Swim-triggered activity of PLLg neurons after efferent nuclei ablation and in mutants lacking α9-nAChRs.

(A) Perturbation schematic. PLLg activity during swims before and after unilateral laser ablation of DELL neurons. Since DELL neurons do not cross the midline, contralateral PLL ganglia serve as controls. (B) Average swim-triggered responses (mean ΔF/F ± s.e.m.) before and after unilateral DELL ablations in neurons from PLL ganglia in the ipsilateral (left, blue lines) or contralateral (right, yellow lines) side to the ablation. Bottom panels: swim probability (n= 6 and 5 fish). (C) Boxplots of z-scored population ΔF/F per fish showing the difference in neuronal activity during swimming and quiescent periods of PLL ganglia located ipsilaterally (blue) or contralaterally (yellow) to the ablation site. Medians shown in color. Differences were computed for each fish before and after DELL ablations. Population values correspond to the median of all PLLg neurons for a given fish (individual cell values in Figure S5D). Paired 2-tailed Wilcoxon signed-rank test: pipsilateral = 0.2188, pcontralateral=1. (D) Circuit perturbation schematic. PLLg activity during swims before and after unilateral laser ablation of OEN neurons. OEN axons also do not cross the midline and therefore contralateral PLL ganglia serve as controls. (E) Average swim-triggered responses (mean ΔF/F ± s.e.m.) before and after unilateral OEN ablations in neurons from PLL ganglia in the ipsilateral (left, blue lines) or contralateral (right, yellow lines) side to the ablation. Bottom panels: swim probability (n= 6 and 5 fish). (F) Boxplots of z-scored population ΔF/F per fish showing the difference in neuronal activity during swimming and quiescent periods of PLL ganglia located ipsilaterally (blue) or contralaterally (yellow) to the ablation site. Medians shown in color. Differences were computed for each fish before and after OEN ablations. Population values correspond to the median of all PLLg neurons for a given fish (individual cell values in Figure S5E). Paired 2-tailed Wilcoxon signed-rank test: pipsilateral = 0.0313, pcontralateral= 0.8125. (G) Perturbation schematic. Hair cells receive cholinergic inputs from OEN efferent neurons (red). If hair cell inhibition is compromised in chrna9a mutants, this should be observed in the activity of PLLg neurons. (H) Average swim-triggered responses (mean ΔF/F ± s.e.m.) of PLLg neurons in chrna9aΔ1049 homozygous (blue) and heterozygous (cyan) siblings, and wild-type controls (wt, gray), (n= 8,14,12 fish). Wild-type fish correspond to one wt sibling and all animals from Figure 2F. Bottom: swim probability. (I) Boxplots of z-scored population ΔF/F per fish showing the difference in neuronal activity during swimming and quiescent periods in wildtype and mutant animals. Medians shown in color. (Kruskal-Wallis one-way analysis of variance, p= 0.0010. Unpaired 2-tailed Wilcoxon rank-sum test with post-hoc Bonferroni correction, pwt:+/− =0.0252, p+/−:−/− =0.0676, pwt:−/− = 3.9692×10⁻⁵). See also Figure S5.
