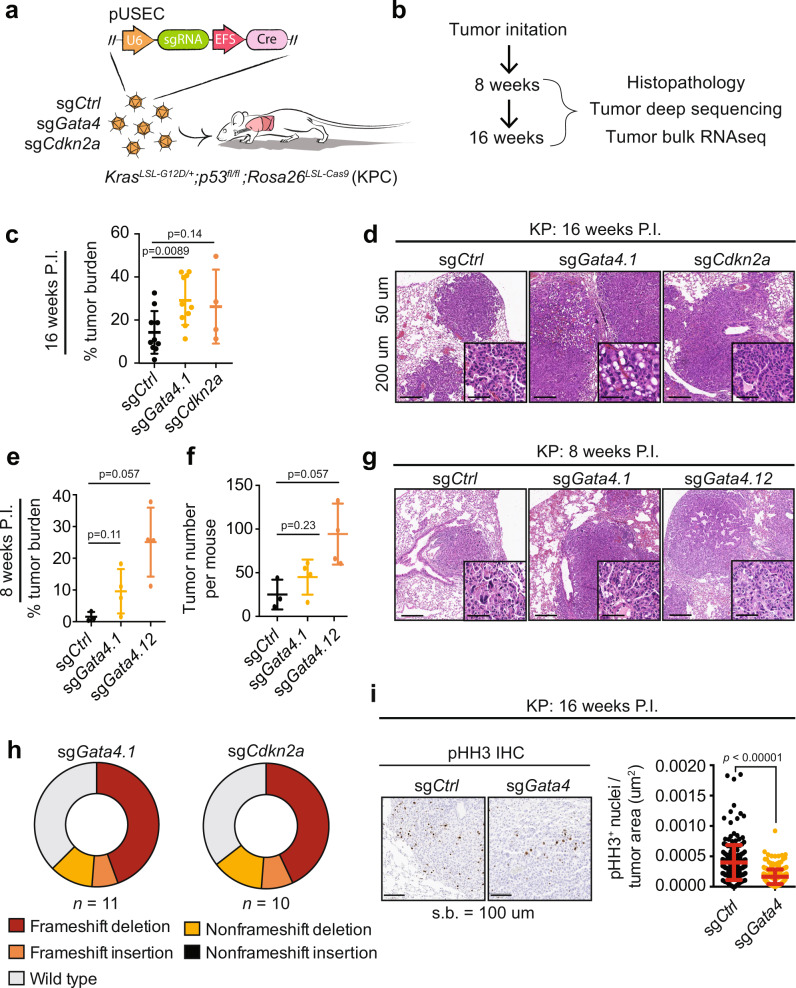
Fig. 1. SASP is a tumor suppressor in the KP autochthonous model of lung cancer and affects tumor initiation rather than tumor cell proliferation.
a Schematic overview of autochthonous lung cancer CRISPR experiment. pUSEC lentiviruses were intratracheally delivered into mouse lungs of KrasLSL-G12D/+;p53fl/fl;Rosa26LSL-Cas9 (KPC) mice to delete genes of interest. sgRNAs include sgCtrl (targeting either tdTomato or a safe harbor locus on Chr4.1), sgGata4.1, sgGata4.12, and sgCdkn2a. b Tissues were collected 8 and 16 weeks P.I. (post-infection) for histopathology, immunohistochemistry, DNA sequencing, and bulk tumor RNA-seq. c Tumor burden at 16 weeks P.I. Burden is defined as total tumor area over total lung area and is assessed from haematoxylin and eosin (H&E) staining of lung sections. Aggregate data from two independent experiments; n = 10 for sgCtrl and sgGata4 and n = 4 for sgCdkn2a. Statistics were derived using a two-sided Mann–Whitney test. d Representative H&E images sectioned lung tumor samples at 16 weeks P.I. Error bars represent the mean ∓ s.d. Scale bar is 50 um for larger image and 200 um for inset. The experiment was performed twice independently. e Tumor burden at 8 weeks P.I. Burden is defined as in panel c. Statistics were derived from a two-sided Mann–Whitney test. Error bars represent the mean ∓ SD. Data are from n = 3 mice from sgCtrl, n = 4 mice from sgGata4.1, and n = 4 mice from sgGata4.12. f Tumor number per mouse at 8 weeks P.I. Tumor number is derived by counting individual tumors on H&E stained lung sections. The statistical test is a two-sided Mann–Whitney test. Error bars represent the mean ∓ SD. Data are from n = 3 mice from sgCtrl, n = 4 mice from sgGata4.1, and n = 4 mice from sgGata4.12. g Representative images of H&E staining of sectioned tissue samples at 8 weeks P.I. Scale bar is 50 um for larger image and 200 um for inset. The experiment was performed once. h CRISPRseq of sgRNA-targeted loci. Sequencing was performed on amplicons centered on the sgRNA cut site. Reads from each biological group were pooled together to show the overall distribution of mutations within each experimental group. Mutational burden was not corrected for tumor purity and therefore is an underestimate of true editing efficiency. Data are from n = 11 tumors for sgGata4.1 and n = 10 tumors for sgCdkn2a. i Representative images of IHC staining for pHH3 (phospho-histone H3) (left) and quantification of IHC for pHH3 staining (right) on serial sections of lung tumor tissue at 16 weeks P.I. Statistics were derived from a two-sided Mann–Whitney test. Error bars represent the mean ∓ SD. Data are from n = 4 mice totalling 209 tumors for sgCtrl and n = 6 mice totalling 327 tumors for sgGata4. Experiment performed once.

