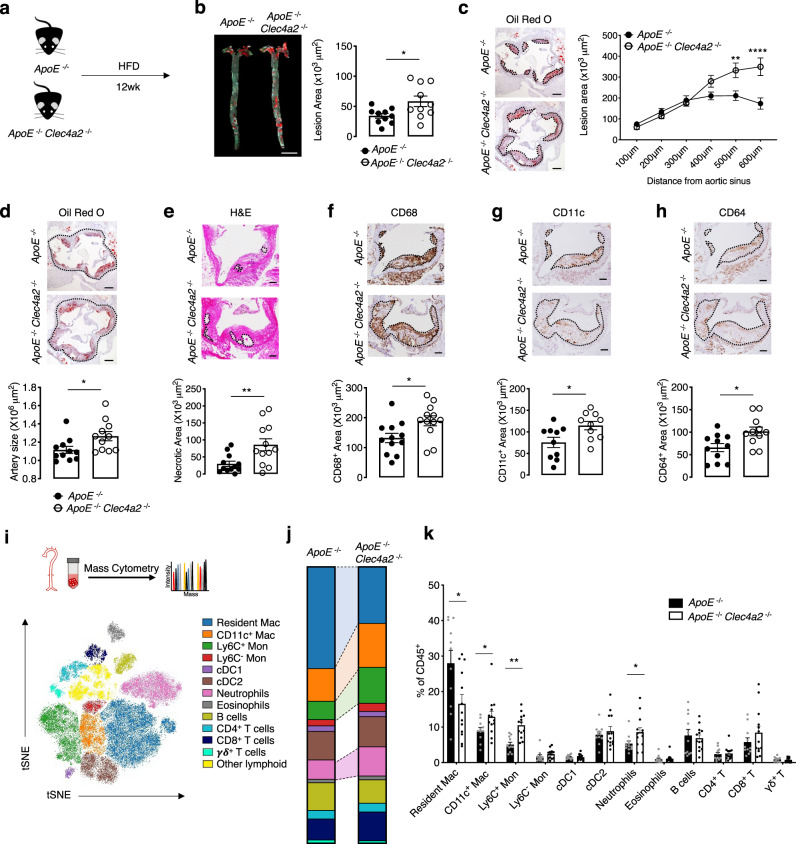
Fig. 4. CLEC4A2 alleviates atherogenesis by maintaining vascular myeloid cell homeostasis.
a Schematic showing the experimental setup to compare 20-week-old ApoE−/− and ApoE−/− Clec4a2−/− littermate mice fed a HFD for 12 weeks. b Representative images and plaque quantification of Sudan IV (red)-stained en face whole aortas of HFD-fed ApoE−/− and ApoE−/− Clec4a2−/− littermate mice (Scale bar: 5 mm) (n = 10 mice each). Two-tailed Student’s t-test. *P = 0.0211. c Representative images and plaque quantification of Oil Red O-stained aortic roots (Scale bar: 200 µm) (n = 12 mice each). Two-way ANOVA. **P = 0.0025, **** P < 0.0001. d Representative images of aortic roots showing arterial size (dotted area) (Scale bar: 200 µm) (n = 11 mice each). Two-tailed Student’s t-test. *P = 0.0279. e Representative images of the aortic root lesion stained with hematoxylin and eosin (H&E) indicating the necrotic core (H&E-free area, dotted) (Scale bar: 100 µm) (n = 12 mice each). Two-tailed Student’s t-test. **P = 0.0080. f–h, Representative images and quantification of CD68 (f), CD11c (g), and CD64 (h)-stained (brown)-area in aortic root lesions (dotted). (Scale bar: 100 µm). Two-tailed Student’s t-test. CD68: n = 12 mice each (*P = 0.0201), CD11c: n = 9–10 mice each (*P = 0.0205), CD64: n = 11 mice each (*P = 0.0137). i, tSNE clustering of live CD45+ cells from whole aortas of ApoE−/− and ApoE−/− Clec4a2−/− mice fed a HFD for 12 weeks by mass cytometry. Leucocyte populations were identified based on expression of 32 markers. j and k Frequency of leucocyte populations in each genotype (ApoE−/−: n = 11 mice; ApoE−/− Clec4a2−/−: n = 13 mice, pooled from three independent experiments). Two-tailed Student’s t-test. Resident Mac: *P = 0.0165, CD11c+ Mac: *P = 0.0477, **Ly6C+ Mon: **P = 0.0084, neutrophils: *P = 0.0469. All data are presented as mean ± SEM. Source data are provided as a Source Data file.

