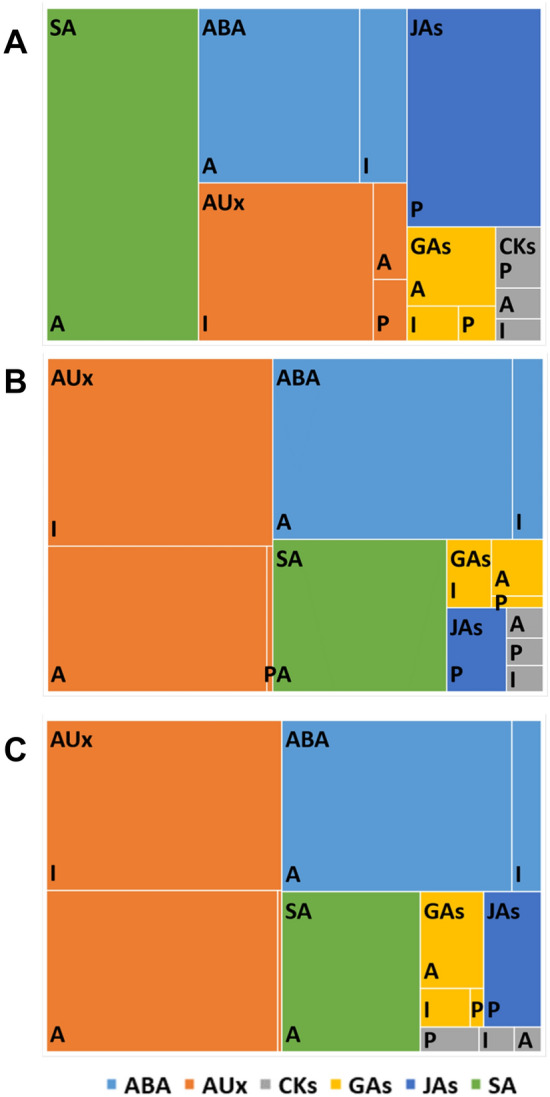
Figure 4.

A treemap chart of the hormonal profile of oat cv. ‘Akt’ embryos. Panel (A) haploid embryos, Panel (B) zygotic embryos, Panel (C) zygotic embryos from ovaries treated with 2,4-D. The total area represents the amount of all measured hormones. Rectangles of different colors: AUx auxins (orange), JAs jasmonates (navy blue), ABA abscisic acid (blue), GAs gibberellins (yellow), SA salicylic acid (green), and CKs cytokinins (grey) represent the share of each compound group divided in to active (A), inactivated (I), and precursor (P) fractions.
