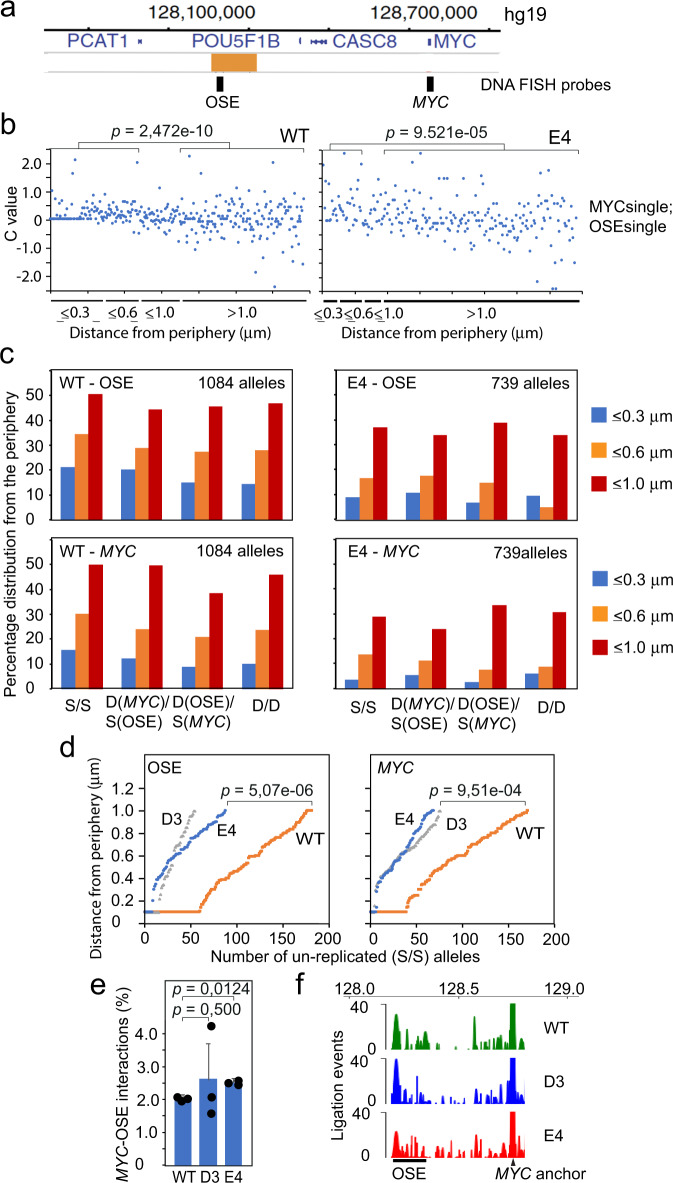
Fig. 5. The CCAT1-specific CTCFBS influences the proximity between the OSE and MYC at the nuclear periphery, but not their overall interaction frequency.
a Schematic map (to scale) of the OSE and MYC regions with the position of the DNA FISH probes indicated. b Analysis of the “c” value (scoring for the difference in the distances of MYC and the OSE from the nuclear periphery) in relation to the proximity of the OSE to the nuclear periphery in control and mutant HCT-116 cells for un-replicated alleles (MYCsingle/OSEsingle). The replication state of the MYC and OSE regions are indicated by the number of replicated alleles (see Supplementary Fig. 6 for additional information). A total of 1085 (Ctrl), and 740 (E4) alleles were counted from two independent experiments. c The overall proximity between the OSE and MYC regions from the nuclear periphery were stratified into three distances. S/S = un-replicated alleles; D(MYC)/S(OSE) = The MYC allele replicated before the OSE allele; S(MYC)/D(OSE) = The OSE allele replicated before the MYC allele; D(MYC)/D(OSE) = Both MYC and OSE alleles replicated. d The cumulative distribution of un-replicated MYC and OSE alleles within one micrometer from the nuclear periphery in WT HCT-116, D3, and E4 cells. The numbers have been derived from the source data of (b, c). e Chromatin fiber interaction analyses (Nodewalk)7,24 showing the percentage of sequences within the OSE region (hg19:chr8:128192176-128309374) that interacted with the MYC anchor (hg19:chr8:128,746,000-128,756,177). f Graphic representation of the interaction patterns in the 5’-flank of the MYC anchor. The data is the average of unique ligation events normalized from three independent experiments. The p values indicated in panels b and d were determined using the two-sided KS test, while the p values in panel e were determined by the two-tailed Student’s t test.

