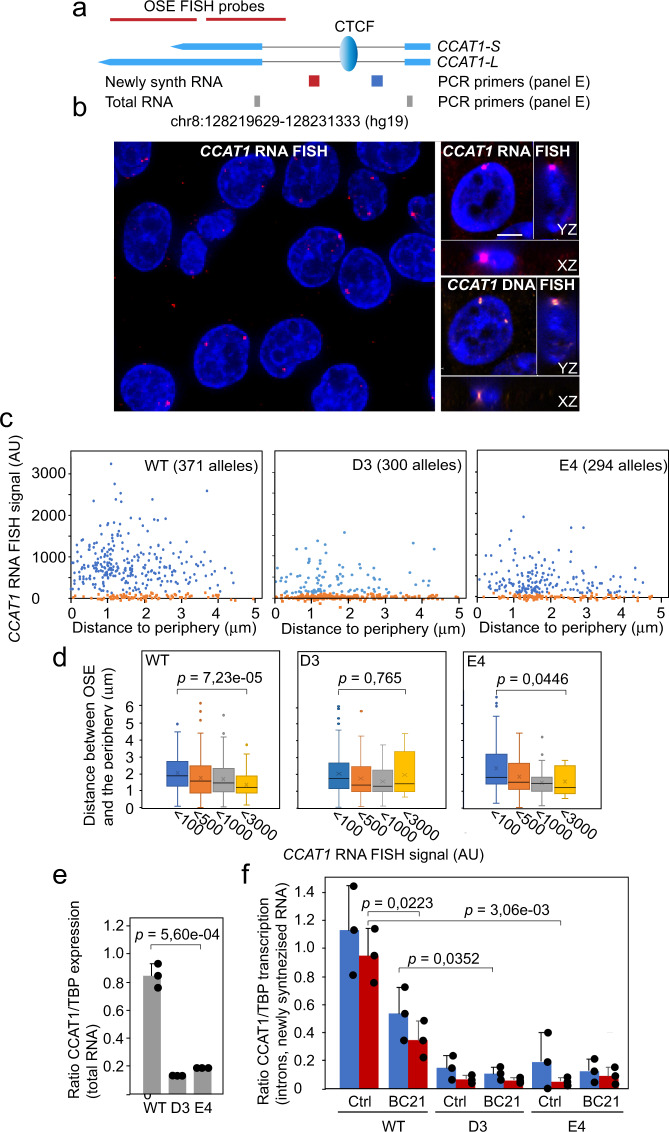
Fig. 6. WNT activates CCAT1 eRNA expression via the CTCFBS to promote its juxtaposition to the nuclear periphery.
a Schematic map of the CCAT1 gene and the position of the CTCFBS and the primers used to assess CCAT1 expression. b Sequential RNA/DNA FISH analyses to score for CCAT1 expression in WT HCT-116 cells. The left image shows a larger view with the right image representing a focal plane of CCAT1 RNA and DNA FISH signals. Bar = 3 μm. c Quantitation of the RNA FISH signals in relation to the nuclear periphery in WT HCT-116 (371 alleles), D3 (300 alleles) and E4 (294 alleles) cells. Data points at or near background (<100 AU) are marked in orange. d Box-and-whisker plots show median values, interquartile ranges and Tukey whiskers (p values: two-sided KS test) of the distribution of the OSE in relation to the nuclear periphery, stratified according to the strength of the RNA FISH signal. In instances where no RNA FISH signal could be detected above background, the peripheral distribution was determined by the OSE DNA FISH signal. e qRT-PCR analyses of processed CCAT1 eRNA of total RNA using primers marked as gray in (a). f qRT-PCR analyses of CCAT1 transcription using newly synthesized (30 min ethynyl-uridine pulse) RNA as templates and primers positioned upstream (blue) or downstream (red) of the CTCFBS, as marked in panel a). The p values indicated in panel d were determined by using the two-sided KS test, whereas the p values shown in (e, f) were determined using the two-tailed Student’s t test.

