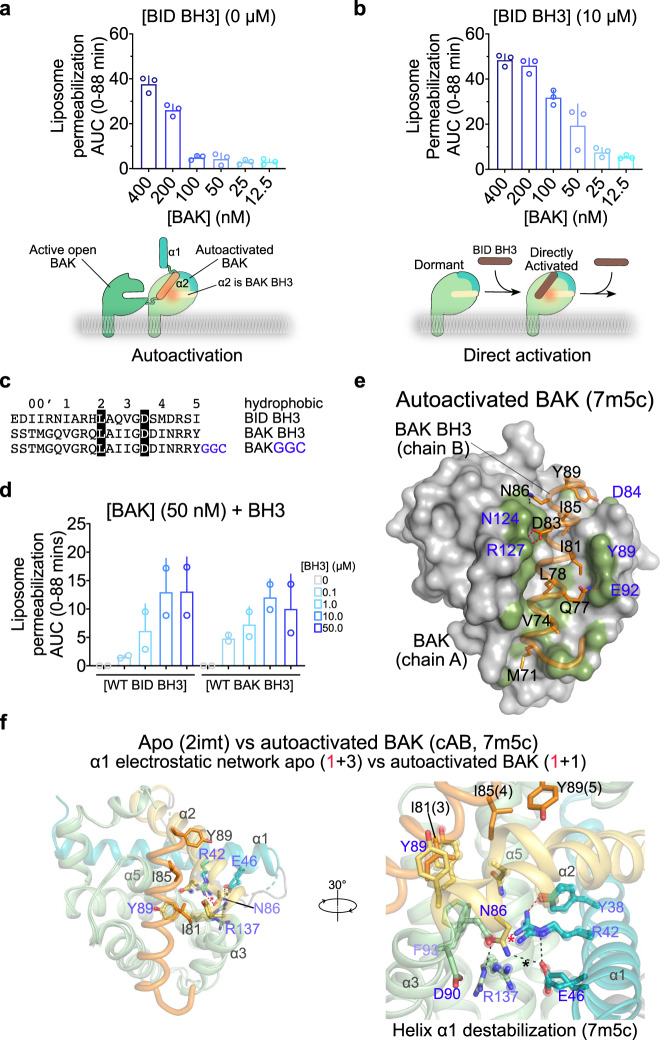
Fig. 1. BH3-in-groove BAK autoactivation by destabilization of helix α1.
a, b BAK autoactivation and direct activation revealed in liposome permeabilization assays quantified as area under the curve (AUC) of kinetic traces in Supplementary Figs. 1 a, b. Data are presented as mean + SD from one representative of n = 4 experiments each of n = 3 technical replicates. c BH3 peptide sequences. Conserved positions in BH3-only Initiators and Effectors are highlighted. The GGC linker (blue) was designed for covalent tethering to BAK G184C. d Liposome permeabilization assays quantified as AUC of kinetic traces from Supplementary Fig. 4 for WT BAK activation by WT BID and BAK BH3 peptides. Data are presented as mean + SEM of n = 2 experiments each of n = 3 technical replicates. e Surface representation of BAK in complex with BAK BH3 peptide showing van der Waals contacts (≤4 Å, green). f Overlay of apo and autoactivated BAK reveals the mechanistic basis of autoactivation as BAK BH3 binding-induced destabilization of the electrostatic network within the protein core at the interface of helices α1, α2, α3, and α5. Apo residues are rendered as sticks and spheres and their electrostatic network contacts (dashed lines) are excluded. Hydrogen bonds ≤3.2 Å (red) and ≤3.6 Å (black) between helix α1 and the rest of the domain identified with * are summarized in brackets, Supplementary Fig. 2d and Supplementary Table 3.

