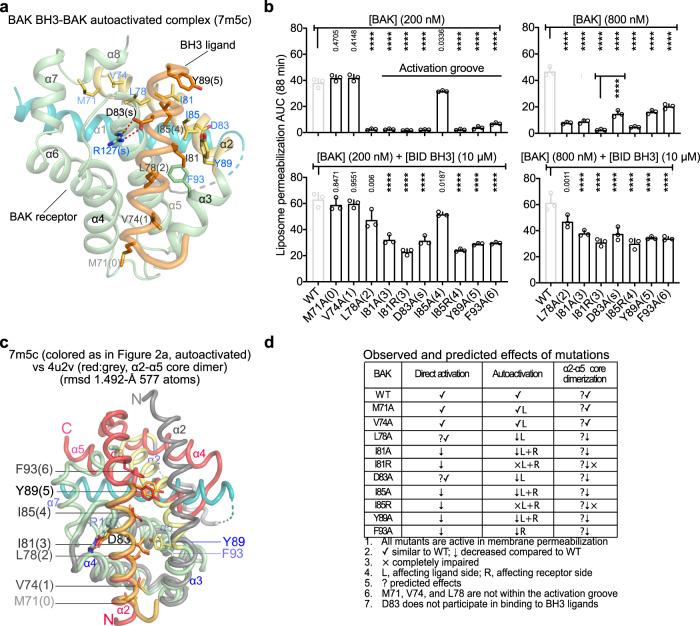
Fig. 2. Direct activation of autoactivation-impaired BAK mutants in vitro.
a Cartoon representation of autoactivated BAK identifying residues mutated in BAK BH3 and the activation groove. b Liposome permeabilization assays quantified as AUC of kinetic traces from Supplementary Fig. 3a at two BAK doses reveal complete and partial impairment in autoactivation (top) and direct activation by BID BH3 peptide (bottom), respectively, for the majority of mutants. Data are presented as mean + SEM of n = 3 experiments each of n = 3 technical replicates. Adjusted p values indicated above each bar were calculated by multiple comparisons using one-way ANOVA with Dunnett (200 nM BAK ± BID BH3, 800 nM BAK + BID BH3) or Tukey test (800 nM BAK); ****P < 0.0001. 95% confidence interval of differences are presented in the Source Data File. c Cartoon representation of BAK BH3-BAK structure overlaid onto that of α2–α5 core BAK dimer. d Summary of observed and predicted (indicated with ? prefix) effect of mutations on direct activation, asymmetric BH3-in-groove autoactivation, and symmetric BH3-in-groove α2–α5 core dimerization.

