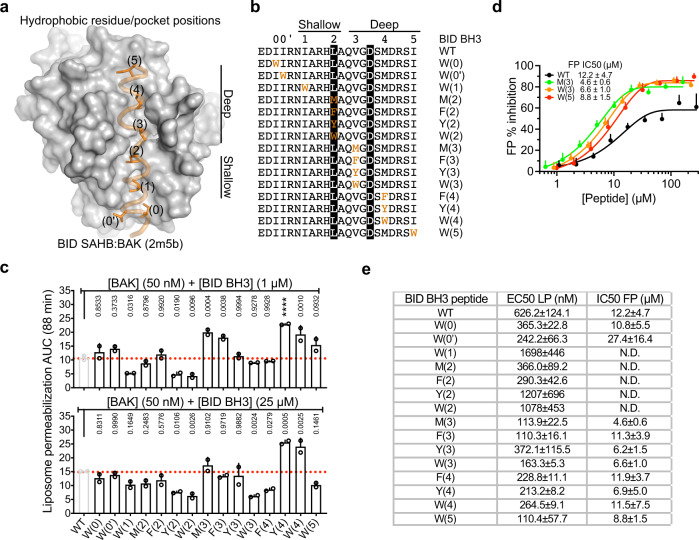
Fig. 4. Surveying activation hotspots in the activation groove of BAK.
a Cartoon:surface representation of the BID SAHB:BAK NMR structure we determined previously showing hydrophobic residues in the BH3 helix and corresponding hydrophobic pocket in the activation groove of BAK. b Alignment of BID-like BH3 peptide sequences indicating M, F, Y, or W substitutions (orange). Positions conserved in BH3 regions of BCL-2 proteins are highlighted black. c Direct activation mode liposome permeabilization with BID BH3 peptides in (b) quantified by AUC of kinetic traces in Supplementary Fig. 6a. Data are presented as mean + SEM of n = 2 experiments each of n = 3 technical replicates. Adjusted p values indicated above each bar were calculated by multiple comparisons to WT BAK using one-way ANOVA with Dunnett test; ****P < 0.0001. 95% confidence interval of differences are presented in the Source Data File. d Competitive fluorescence polarization (FP) assay measuring displacement of BID SAHB-fluorescein peptide from GST-BAK by BH3 peptides in (b). Data are presented as mean ± SD from n = 9 experiments. e Summary of liposome permeabilization (LP) EC50 values and fluorescence polarization (FP) IC50 values for the functional and binding data in panels (c) and (d) and Supplementary Fig. 6.

