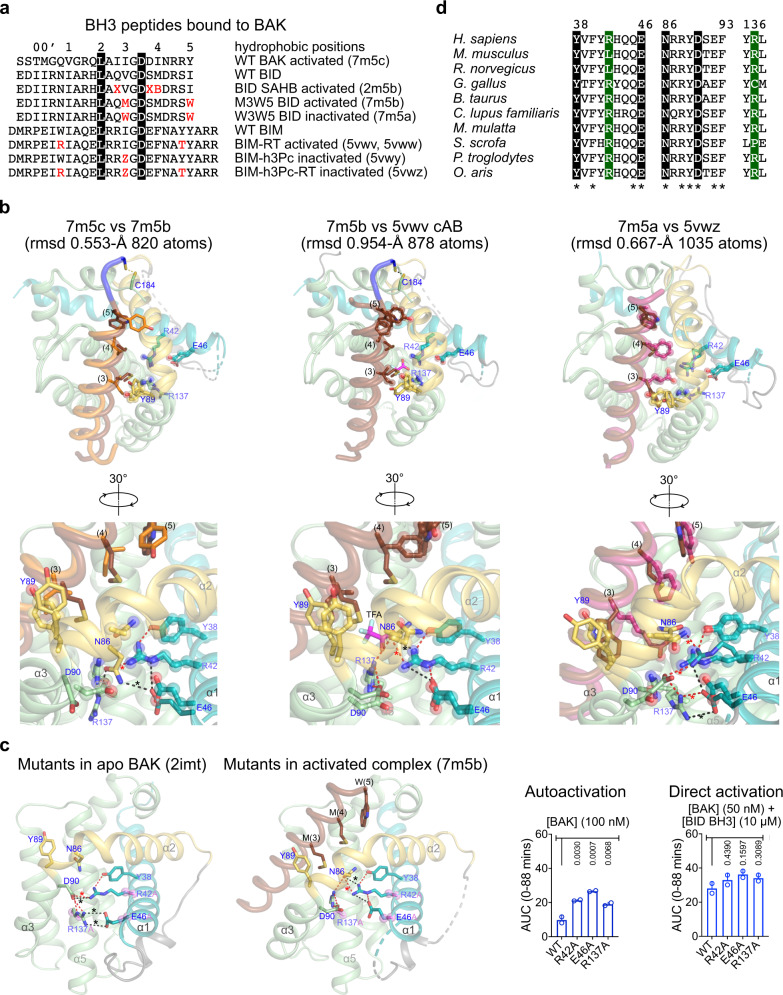
Fig. 6. Similarities and differences among BH3 ligand-bound BAK structures.
a Alignment of BH3 peptide ligands used to determine structures in complex with BAK. Unnatural amino acids B, norleucine; X, pentenylalanine; Z, pentenylcarboxylate. b Overlays of autoactivated and directly activated BAK (left, BAK BH3 orange), directly activated BAK by BID- and BIM-like BH3 (middle), and BID- or BIM-based BH3 inactivated BAK complexes (right, BIM-h3Pc-RT pink). Residues from 7m5b, 5vwv, and 5vwz in the left, middle, and right panels are rendered as sticks and spheres and their electrostatic network contacts (dashed lines) are excluded in the bottom views. c Cartoon representation of apo and activated BAK showing the location of alanine mutations in the buried electrostatic network. AUC quantification of kinetic traces for liposome permeabilization assays in Supplementary Fig. 8b. Data are presented as mean + SEM of n = 3 experiments each of n = 3 technical replicates. Adjusted p values indicated above each bar were calculated by multiple comparisons to WT BAK using one-way ANOVA with Dunnett test. 95% confidence interval of differences are presented in the Source Data File. d Sequence alignment reveals conservation of the buried electrostatic network stabilizing helix α1, which involves Y38, R42, R46, N86, D90, and R137 in human BAK. Divergence observed in rodents (R42L), chicken (R137C), and pigs (R137P) is predicted to destabilize the α1 electrostatic network thereby lowering the threshold for BAK activation. Black and green highlights represent 100% and >75% conserved residues, respectively. An alternative electrostatic network stabilizes α1 in apo mouse BAK as shown in Supplementary Fig. 8c.

