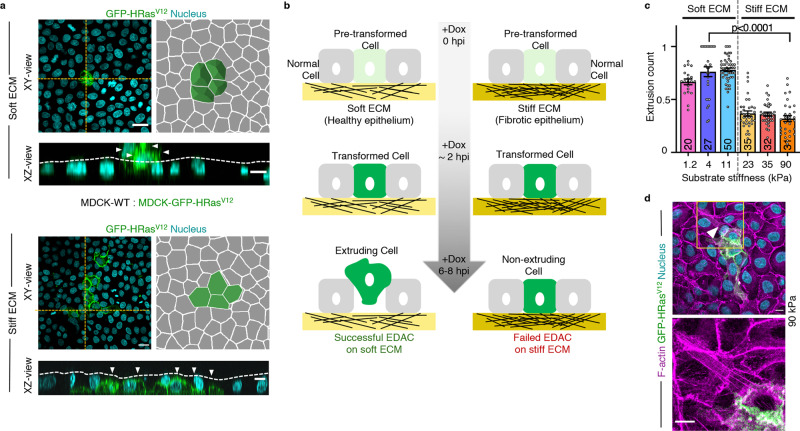
Fig. 1. Matrix stiffening attenuates extrusion of HRasV12-transformed cells during EDAC.
a Fluorescence images of GFP-HRasV12 expressing colony extrusion on soft (4 kPa) and stiff (90 kPa) substrates in XY-plane; followed by an illustration depicting the visual metric employed to quantify extrusion. Rounded-up cells expressing GFP-HRasV12 (as seen on soft ECM) are taken as extruded. Non-extruded GFP-HRasV12 cells remain in-plane with other cells, as evident on stiff ECM. (Bottom panels) The yellow-dotted lines visually guide the epithelium surface in XZ-plane. GFP-HRasV12 cells extruded over this surface on soft ECM (top) whereas they remained within this surface on stiff ECM (bottom). White arrowheads indicate GFP-HRasV12 cells. b Diagram representing different phases of extrusion of transformed cells and stiffness-dependent outcome of EDAC. c Scatter bar plot depicting the fraction of GFP-HRasV12 expressing colonies extruded over substrates of varying stiffness at 6 hpi. Distinct decrease in extrusion of transformed cells observed with increase in substrate stiffness. The number of colonies counted is indicated inside each bar. Data are mean ± s.e.m. collected over three independent biological replicates. Statistical significance was assessed using Mann–Whitney t-test (two-tailed). p = 2.8490e−08. d Cytoskeletal morphology of non-extruded colonies over stiff ECM at 24 hpi. White arrowheads indicate basal actin fibres associated with HRasV12- cells on stiff ECM (90 kPa), stained with AlexaFluor647-Phalloidin. Inset: Magnified view of the yellow-boxed region with actin fibres pointed out by white arrowheads. Scale bars = 20 μm (a, XY-view), 10 μm (a, XZ-view; d).

