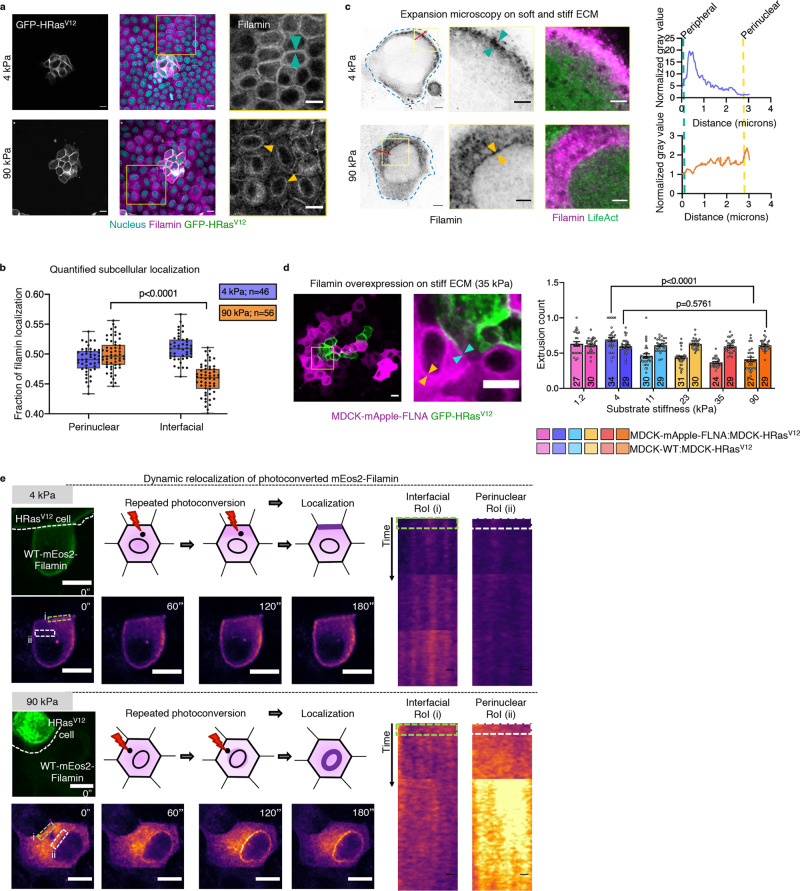
Fig. 2. ECM stiffness-dependent localization of filamin determines EDAC efficacy.
a Immunostaining image of mosaic monolayer of MDCK-WT:MDCK-GFP-HRasV12 cultured on soft (top panels) and stiff (bottom panels) ECM. From left to right: GFP-HRasV12, filamin in the mosaic monolayer and magnified view of the boxed regions. Cyan arrowheads indicate interfacial filamin enrichment on soft ECM, and yellow arrowheads indicate perinuclear filamin localization on stiff ECM. Scale bars = 10 μm. b Box-and-whiskers plot depicting the fraction of filamin mean fluorescence intensity at perinuclear and interfacial regions, per cell, on soft (4 kPa) and stiff (90 kPa) ECM. Statistical significance was assessed using an unpaired Student t-test with Welch’s correction (two-tailed). p = 6.35542e−09. For boxplots, centre line denotes median, box displays the interquartile range, whiskers indicate range not including outliers (1.5× interquartile range). c Post expansion images of LifeAct-GFP MDCK cells stained for endogenous filamin and cultured on either 4 or 90 kPa PAA gels. Filamin localization differences are indicated by yellow arrowhead (perinuclear) and cyan (interfacial) in the insets. Scale bar = 2 µm; Inset = 1 µm. Fluorescence intensity line scan plots for the red line marked in the filamin channel. d (Left) Fluorescence images of a mosaic monolayer of filamin-over expressing MDCK cells and MDCK-GFP-HRasV12 co-cultured on a stiff substrate with a magnified view of the boxed region. Yellow and cyan arrowheads indicate perinuclear and interfacial filamin accumulation respectively. (Right) Scatter bar plot depicting the fraction of GFP-HRasV12 expressing colonies extruded over substrates of varying stiffness. For each stiffness, left bars are for mock MDCK-WT:MDCK-GFP-HRasV12 and right bars are for MDCK-mApple-FLNA:MDCK-GFP-HRasV12 mosaic populations. Stable over-expression of filamin in surrounding cells rescued extrusion of transformed populations on the stiff substrate. The number of colonies counted is indicated inside each bar. Data are mean ± s.e.m. collected over three independent biological replicates. Statistical significance was assessed using unpaired Student’s t-test with Welch’s correction (two-tailed). Significance value (when p < 0.0001) p = 9.27612e−09. Source data (b, d) are provided as a Source Data file. e Photoconversion of mEos2-filamin to study filamin localization dynamics. mEos2-filamin cell interfacing with an HRasV12 cell was stimulated and tracked for 180 s, as depicted in the schematic. Snapshots of mEos2-filamin dynamics indicate dynamic changes in localization. Kymographs of interfacial (i, green box) or perinuclear (ii, white box) regions show enrichment of filamin at the interface (soft ECM, top panel) or perinuclear region (stiff ECM, bottom panel). Scale bars = 5 μm.

