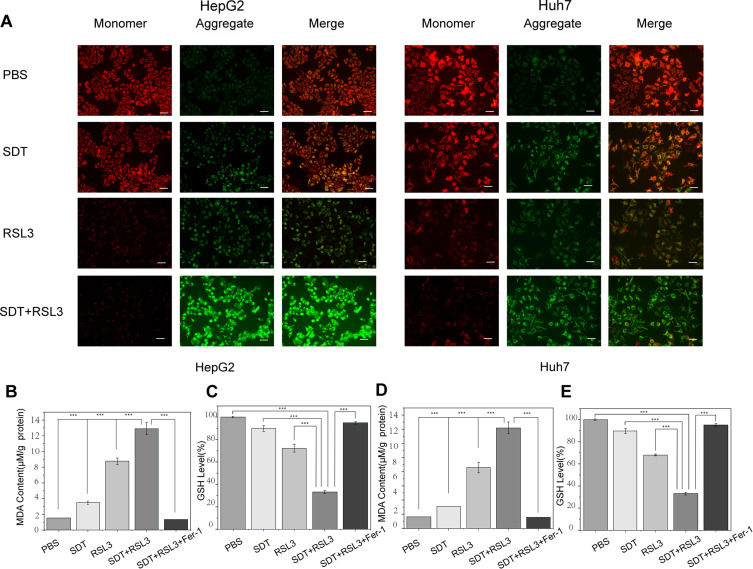
Figure 3.
Analysis of Mitochondrial membrane potential (MMP) and the function of RSL3@O2-ICG NBs in ferroptosis. (A) Fluorescence microscope images of the JC-1 monomer (green channel), and aggregate (red channel) in the mitochondria of HCC cells after differential treatments as indicated; (B–E) DTNB assay of GSH Level, MDA examination in HCC cells under different treatment. ***P<0.001.

