Figure 7.
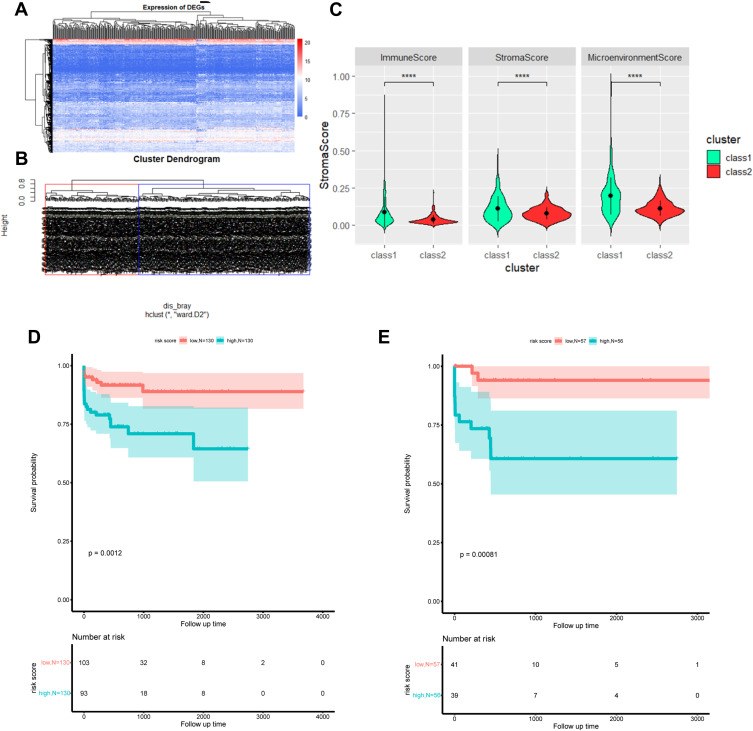
DEG function enrichment and DEG expression in TCGA hepatocellular carcinoma data and immune infiltration status. (A) Hierarchical clustering heat map of the expression of the intersection of differentially expressed genes between A vs B and C vs D in TCGA hepatocellular carcinoma RNA-seq; (B) overlapping DEG in TCGA hepatocellular carcinoma patients based on the hierarchical clustering of expression, red and Blue is the two types of aggregation, defined as class 1 and class 2; (C) box plot of the difference in immune cell abundance between class 1 and class 2 in TCGA hepatocellular carcinoma (t-test, p<0.05), green represents class 1 and red represents class 2; (D) the prognosis of the two types in the training set (Log rank test, p<0.05); (E) the prognosis of the two types in the test set (Log rank test, p<0.05); ****P<0.0001.

