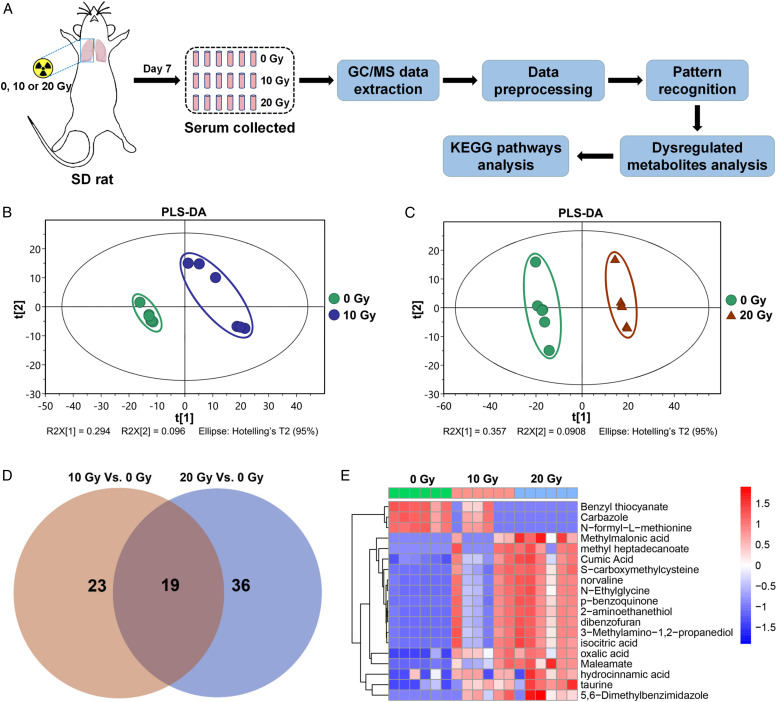
Figure 1.
(a) Schematic diagram of radiation-induced lung injury models in SD rats and the procedures for serum metabolomics analysis using gas chromatographymass spectrometry. Rats were irradiated with 0, 10, or 20 Gy thoracic radiation. The degree of separation among the 10 Gy vs 0 Gy group (b) and the 20 Gy vs 0 Gy group (c) of serum samples in the partial least squares discriminant analysis (PLS-DA) score maps. (d) Venn diagram of differential metabolites between the 10 Gy vs 0 Gy group and the 20 Gy vs 0 Gy group. (e) Heatmap plot of dose-dependent metabolites among the 3 groups.

