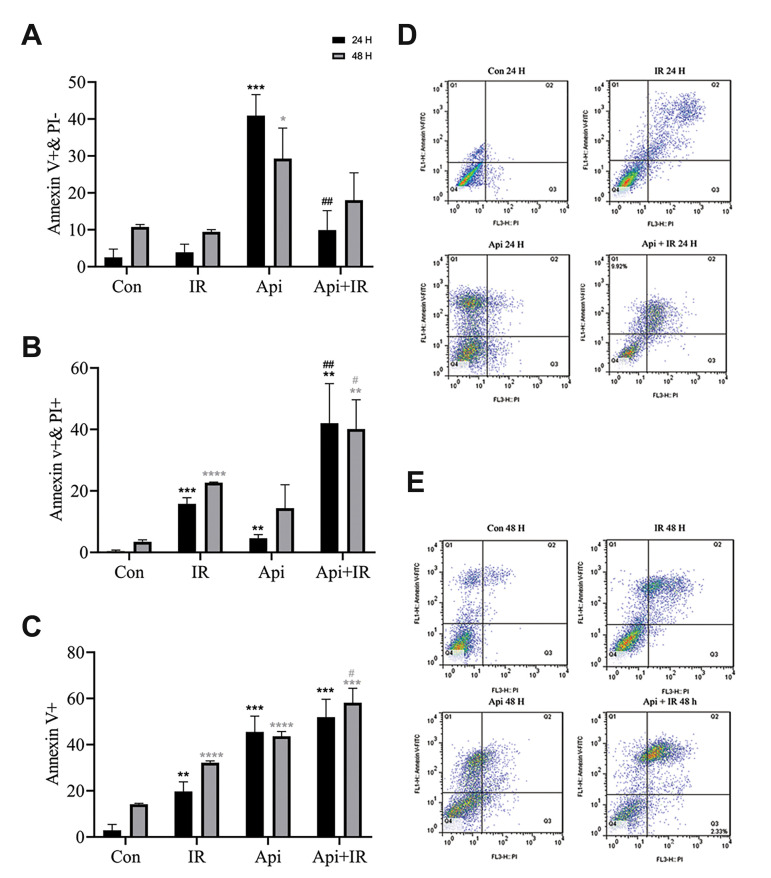
Fig.2.
Flow cytometry analysis of the effect of 65 µM Apigenin (Api), 2 Gy ionizing radiation (IR), and their combination on necrosis and apoptosis induction. A. The percentage of early apoptosis induction. B. The percentage of late apoptosis/secondary necrosis induction. C. The percentage of the combination of early apoptosis and late apoptosis/secondary necrosis cell fractions. D. Apoptosis dot-plot 24 hours after treatment. E. Apoptosis dot-plot 48 hours after treatment. Data are shown as % of the untreated control group. Mean ± standard error of the mean (SEM) are obtained from three independent repetitions. **; P<0.01, ***; P<0.001 versus the control 24 hours after treatment. *; P<0.05, **; P<0.01, ***; P<0.001, ****;P<0.0001 versus the control 48 hours after treatment, ##; P<0.01 versus Api 24 hours after treatment, #; P<0.05, versus Api 48 hours after treatment, PI; propidium iodide, h; Hours, and Con; Control.

