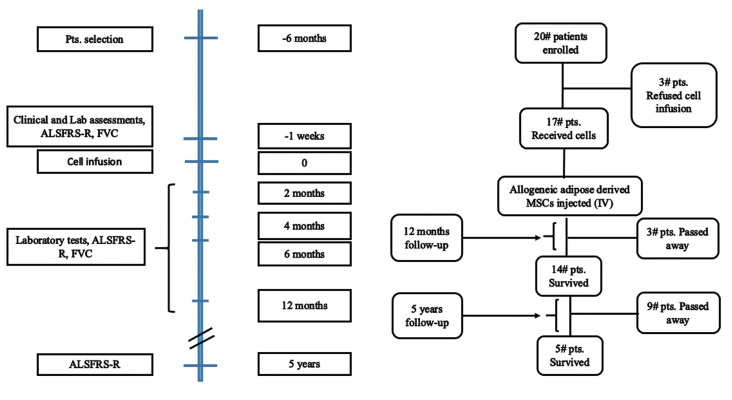
Fig.1.
Study flow diagram. Different time points for follow-up. The total number of patients enrolled in the study and during follow-up. Laboratory tests which were performed: routine blood tests and serum biochemistry and liver function tests as well as renal functional tests. Pts; Patients, FVC; Forced vital capacity, and ALSFRS-R; ALS Functional Rating Scale-Revised.

