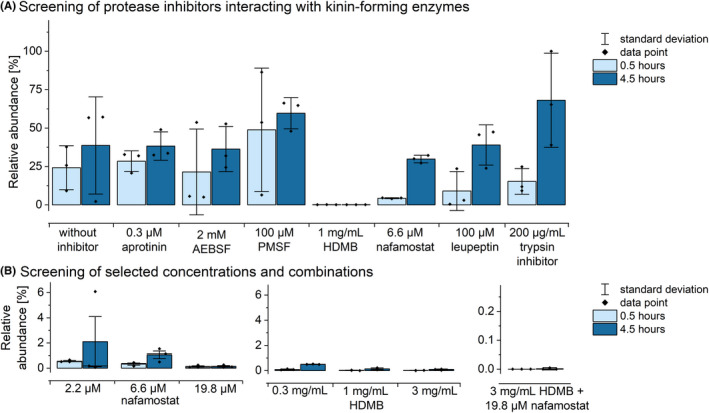
FIGURE 4.

Effects of distinct inhibitors on the formation of bradykinin in citrate plasma. The relative abundance of bradykinin 0.5 and 4.5 hours after blood sampling is shown. (A) Results of the screening of multiples protease inhibitors is shown. (B) The evaluation of distinct concentrations of the best‐performing inhibitors HDMB and nafamostat and their combination are depicted. Mean values with standard deviation and individual data points (n = 3)
