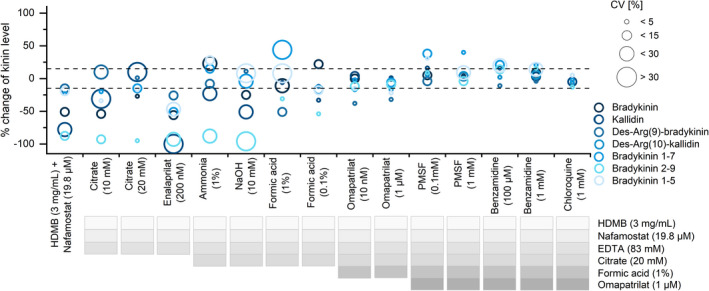
FIGURE 5.

Development of the customized protease inhibitor. The percentage change of spiked kinin levels (1 ng/mL) in plasma after 3 h of benchtop storage using different protease inhibitor approaches is shown. Mean values (n = 3) with their coefficient of variations (CV) are presented. The dashed line represents the maximum deviation of ±15% according to the US Food and Drug Administration guideline. 27 HDMB, hexadimethrine bromide
