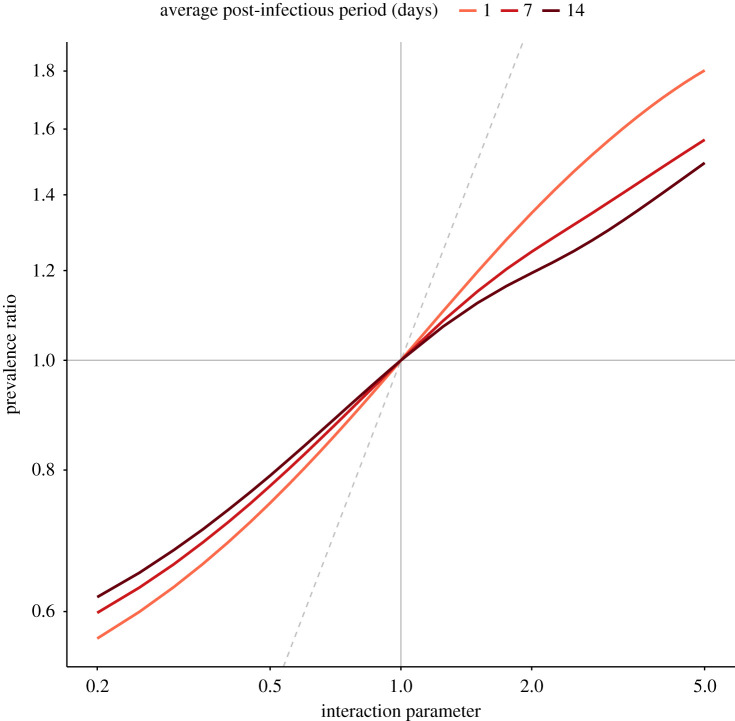
Figure 2.
Relationship between strength of interaction and prevalence ratio for uniform interactions between influenza and SARS-CoV-2. The scenarios tested correspond to (x-axis), for three different values of the average post-infectious period (1/δ = 1/δ1 = 1/δ2); other parameters were fixed to model the coupled dynamics of influenza and SARS-CoV-2 (cf. table 1). The dashed grey identity line depicts equality between the prevalence ratio and the true strength of interaction (PR = θ). The x- and y-axes are log-transformed. (Online version in colour.)

