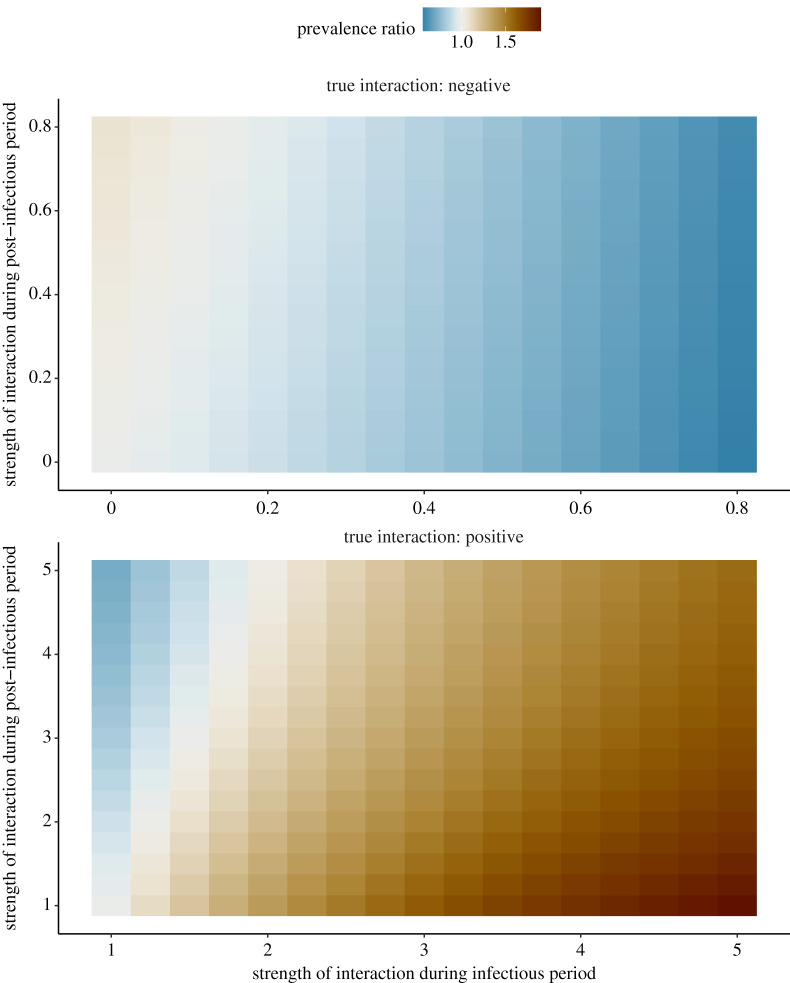
Figure 3.
Relationship between strength of interaction and prevalence ratio for non-uniform interactions between influenza and SARS-CoV-2. The scenarios tested correspond to and ; other parameters were fixed to model the coupled dynamics of influenza and SARS-CoV-2 (cf. table 1). For negative interactions (top panel), the x-axis represents 1 − θ(I) and the y-axis 1 − θ(T); for positive interactions (bottom panel) θ(I) and θ(T). Hence, in either panel the true strength of interaction increases from left to right and from bottom to top. (Online version in colour.)

