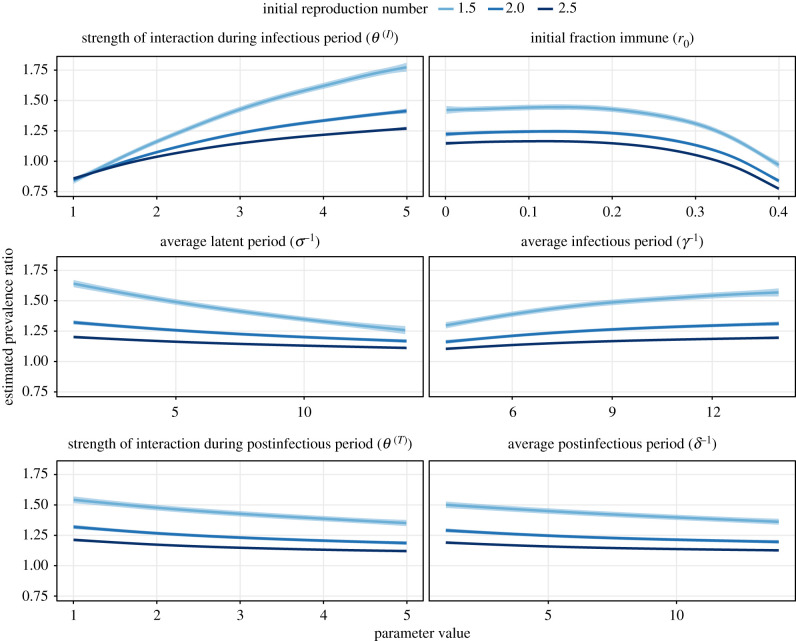
Figure 4.
Global sensitivity analysis of prevalence ratio for positive virus–virus interactions. The association between the prevalence ratio and each input parameter was estimated using a GAM with cubic splines (sample size n = 103), for three different values of the initial reproduction number (1.5, 2.0 and 2.5). The corresponding adjusted R-squared equalled 97.4%, 97.5% and 97.9%. Each panel represents an input parameter, with the line (envelope) indicating the estimated (99% confidence interval) prevalence ratio while holding the other parameters fixed at σ−1 = γ−1 = δ−1 = 7 days, θ(I) = θ(T) = 3 and r0 = 0.2. For visual clarity, the x-axis values differ between panels (all periods are in days). (Online version in colour.)

