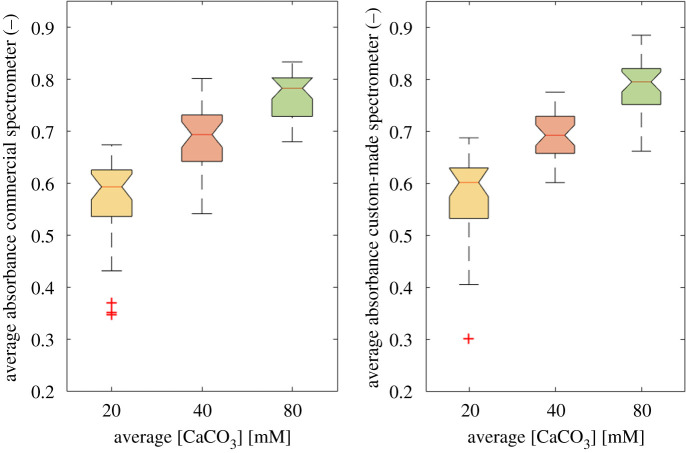
Figure 7.
Average absorbance distribution at the selected wavelength. The panels show the average absorbance measured with the commercial (left) and the custom-made (right) spectrometer devices. A different colour code is used for each different CaCO3 mM concentration (i.e. 20 = yellow, 40 = red and 80 = green). (+, outlier values).

