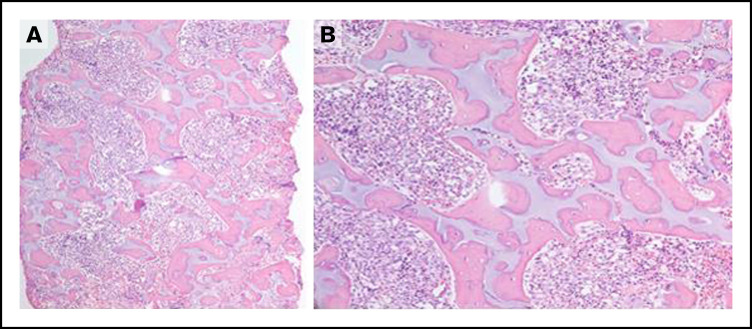
Figure 1.
Severe phenotype of the subject with SBDS c.183_184delTAinsCT/c.523C>T (p.Lys62*/p.Arg175Trp) and lacking the c.258 + 2T>C variant. (A-B) Bone marrow biopsy demonstrating irregular islands of cartilage surrounded by osteoid with increased bone-to-marrow space ratio and a loose fibroblastic network surrounding the bone islands. Original magnification ×40 (A), original magnification ×200 (B); hematoxylin and eosin stain.

