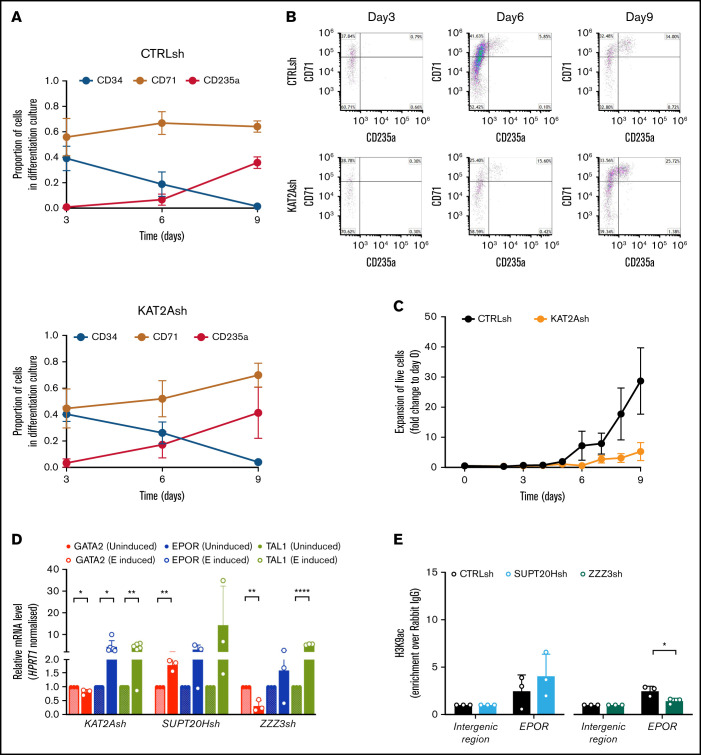
Figure 4.
KAT2A SAGA and ATAC complexes differentially affect erythroid lineage progression. (A) Erythroid differentiation of HSC/MPP sorted from CD34+ cells of individual CB samples transduced with CTRLsh (top) and KAT2Ash (bottom) in liquid cultures. CD34 marks HSC and progenitors; CD71 and CD235a mark early and late differentiated erythroid cells. Data summarize mean ± SEM of 4 independent differentiation experiments. (B) Flow cytometry quantitative analysis of CTRLsh and KAT2Ash HSC in erythroid differentiation cultures in panel A. Representative plots. (C) Expansion of CTRLsh and KAT2Ash HSC in erythroid differentiation cultures in panel A. (D) qRT-PCR analysis of erythroid gene expression progression in K562 cells transduced with KAT2Ash, SUPT20Hsh, or ZZZ3sh and treated with 1.5% DMSO for erythroid molecular induction. Mean ± SD of n >3 independent experiments; data are represented relative to day 0 normalized to HPRT1 housekeeping gene. Two-tailed paired Student t test for significance *P < .05, **P < .01, ****P < .0001. CTRLsh-transduced cells for the same experiment shown in supplemental Figure 4C. (E) H3K9ac ChIP-qPCR analysis of EPOR locus in K562 cells upon SUPT20H and ZZZ3 knockdown. N ≥ 3 independent experiments. Mean ± SEM of enrichment relative to rabbit IgG, with normalization to control intergenic region with no significant H3K9ac enrichment. Two-tailed Student t test for significance *P < .05.

