Figure 7.
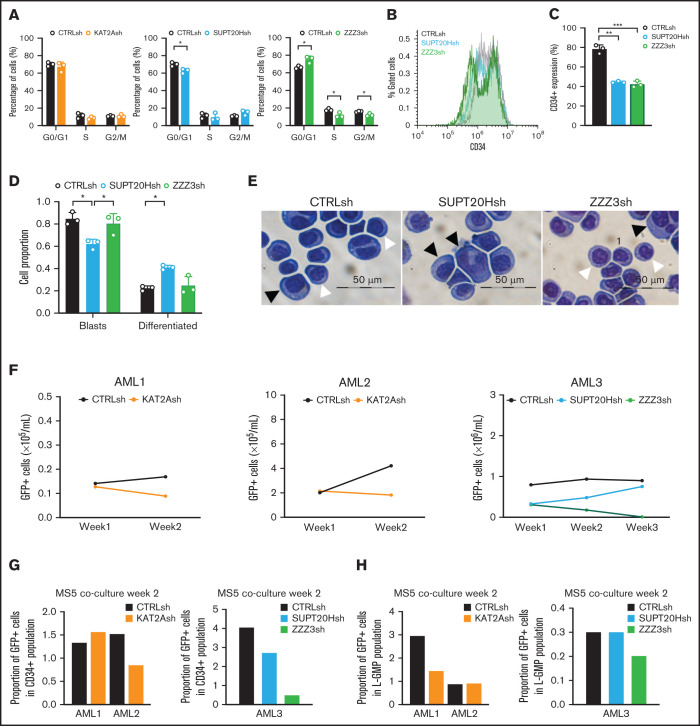
KAT2A complex activity maintains propagation of undifferentiated cultured and primary CD34+AML cells. (A) Quantification of flow cytometry analysis of cell cycle in Kasumi-1 cells transduced with KAT2Ash, SUPT20Hsh, and ZZZ3sh. Mean ± SEM of 3 independent experiments. Two-tailed Student t test for significance *P < .05. (B) Representative flow cytometry overlay plot of analysis of undifferentiated marker CD34 in KG1a cells transduced with CTRLsh, SUPT20Hsh, and ZZZ3sh. (C) Quantification of CD34+cells in transduced KG1a cells in panel B. N = 3 independent experiments. Two-tailed Student t test for significance **P < .01. (D) Quantification of blast-like and differentiated cells in KG1a cultures transduced with CTRLsh, SUPT20Hsh, and ZZZ3sh. Scoring of 3 randomly selected fields of >100 cells; Two-tailed Student t test for significance; *P < .05. (E) Representative photographs of KG1a cytospins. White arrow heads denote blast-like cells; black arrow heads denote differentiated cells. Bar represents 50 μm. (F) Growth of human primary AML cells (CD34+samples; details in supplemental File 5) transduced with CTRLsh, KAT2Ash, SUPT20Hsh, or ZZZ3sh and maintained in the MS5 coculture system for 2-3 weeks. (G) Percentage of GFP+ CD34+ cells in AML samples in panel F analyzed at week 2 of the MS5 coculture. Analysis gates are presented in supplemental Figure 6A. Data are normalized to global GFP level to correct for unequal GFP transduction levels. (H) Percentage of GFP+ GMP-like (L-GMP) cells at week 2 of the MS5 coculture system in AML samples in panel F. Analysis gates in supplemental Figure 7A. GFP transduction correction as in panel G.

