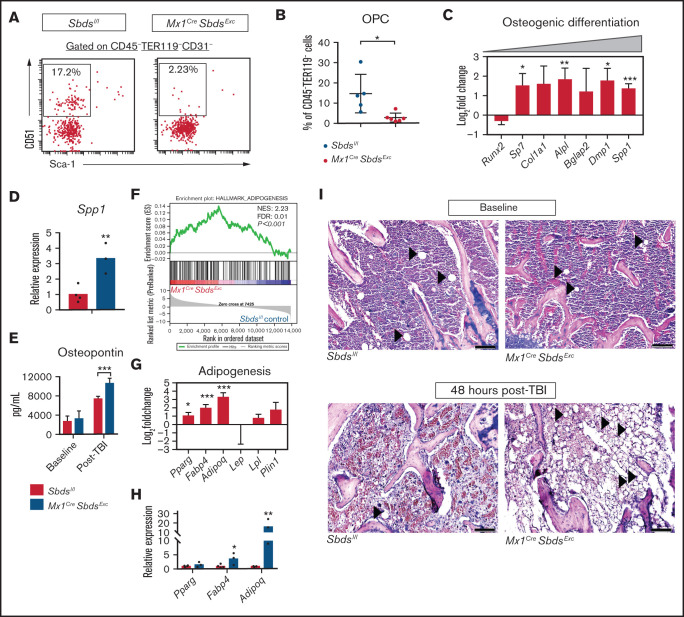
Figure 3.
SBDS deficiency in BM niche cells results in decreased OPCs and increased adipocytes in BM after TBI. (A) Representative dot plots show gating strategies used to define CD31-CD51+Sca-1- OPCs in CD45-TER119- BM stromal cells. (B) Mx1CreSbdsExc mice (n = 5) show reduced percentages of OPCs in CD45-TER119- BM stromal cells compared with controls (n = 6) at 24 hours after 1100 cGy TBI. (C) RNA-seq analysis demonstrating changes of mRNA expression in genes critical for osteoblast differentiation in BM stromal cells of irradiated (24 hours after 1100 cGy TBI) Mx1CreSBDSExc vs control mice (n = 5 mice per group). A positive log-fold change in this plot indicates higher expression in Mx1CreSBDSExc stromal cells. (D) qPCR confirms higher expression of the terminal osteoblast marker Spp1 (Osteopontin) in BM niche cells from irradiated (24 hours after 1100 cGy TBI) Mx1CreSbdsExc mice (n = 3) compared with controls (n = 4). (E) ELISA demonstrating increased osteopontin expression in BM plasma supernatants harvested from Mx1CreSBDSExc vs control mice 48 hours after 1100 cGy TBI (n = 5 for Mx1CreSBDSExc group and n = 6 for control group), but similar expression in the two groups at baseline (n = 5 for Mx1CreSBDSExc group; n = 7 for control group). (F) GSEA plot shows upregulation of adipogenesis-related gene expression in the BM stromal cells of irradiated (24 hours after 1100 cGy TBI) Mx1CreSBDSExc mice vs controls (n = 5 mice per group). The green line in the GSEA plot represents the running enrichment score (ES) for the gene set within the ranked list of genes. The value at the peak of the green line is the final ES. The black bars in the middle of the GSEA plot represent where the genes in the gene set appear in the ranked list. NES, normalized enrichment score; FDR, false-discovery rate. (G) Increased mRNA expression of several genes related to adipogenesis, including Pparg, Fabp4, and Adipoq, in the BM stromal cells of irradiated (24 hours after 1100 cGy TBI) Mx1CreSBDSExc mice compared with controls. (H) qPCR confirmed that BM niche cells from irradiated Mx1CreSbdsExc mice (n = 3) exhibit higher expression of Fabp4 and Adipoq, which is critical for adipogenesis, compared with controls (n = 4) at 24 hours after 1100 cGy TBI. (I) Hematoxylin and eosin stains show increased adipocytes in BM from Mx1CreSBDSExc vs control mice at 48 hours after 1100 cGy TBI but not at baseline. Black arrowheads indicate adipocytes. Scale bar: 200 µm. *P < .05; **P < .01; ***P < .001; Student t-test or DESeq2 statistical test.

