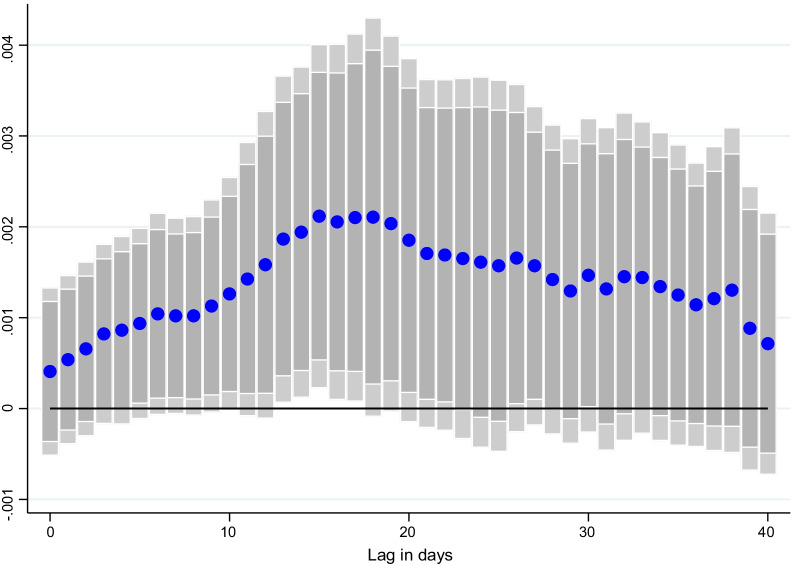
Fig. 4.
Effect of vaccinations on CO emissions per capita, at different lags. Coefficient is reported for each lag ℓ (1–40), and based on for a sample of 44 countries using daily data from December 20, 2020–June 16, 2021. denotes CO emissions per capita and is the surprises in vaccines administered (per capita). and are the country and time fixed effects. X is a vector of control variables which includes the level of new cases, NO2 and CO emissions per capita, the stringency of containment measures index, and mobility indices at t-1. Lightly shaded bars denote 90 percent confidence bands, and dark-shared bars denote 95 percent confidence bands

