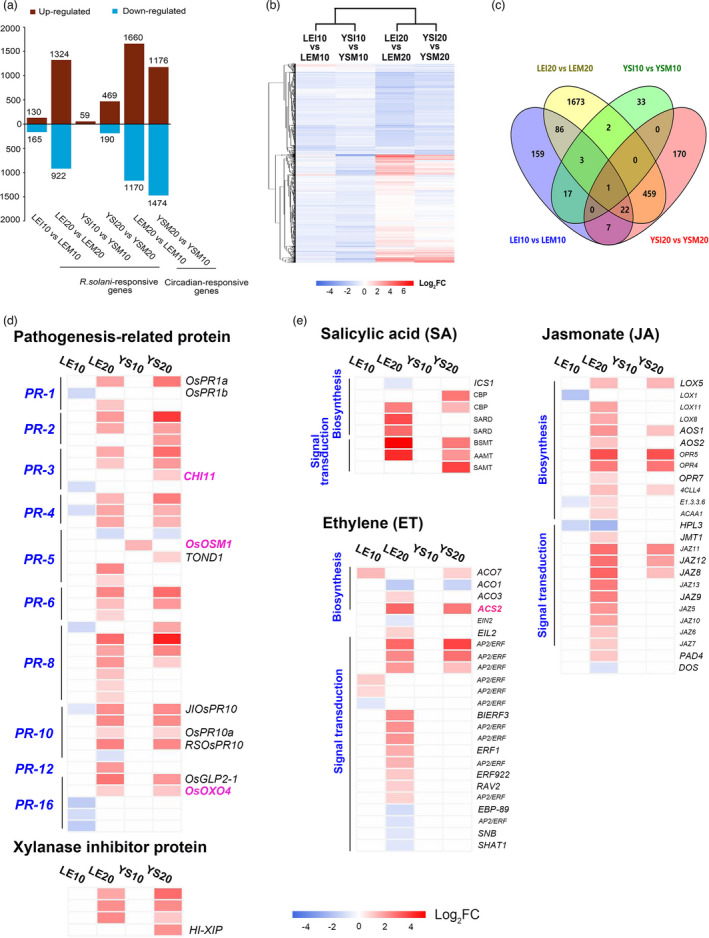
Figure 2.

Resistant responses were activated by Rhizoctonia solani (R. solani) invasion as revealed by transcriptomics. (a) Numbers of R. solani‐ and circadian‐responsive genes detected in each comparison. (b) Hierarchical clustering analysis of 2632 differentially expressed genes (DEGs) in response to R. solani. DEGs were identified using |Log2‐Fold change (FC)| ≥0.75 and q‐value <0.1 as the cut‐offs. (c) Four‐way Venn diagram showing the number of common and unique R. solani‐responsive genes among four comparisons. (d) Comparison of YSBR1 and Lemont DEGs involved in pathogenesis‐related proteins (PRs) and xylanase inhibitor proteins (XIPs). (d) Comparison of YSBR1 and Lemont DEGs involved in pathogenesis‐related proteins (PRs) and xylanase inhibitor proteins (XIPs). (e) R. solani infection affects the hormone signal in both varieties. The DAVID (https://david.ncifcrf.gov/) and KEGG (https://www.kegg.jp/kegg/tool/) websites were used for gene annotation The scale bars display the Log2‐FC, shown in red when >0.75, in blue when <−0.75, and in white when −0.75 ~ 0.75.
