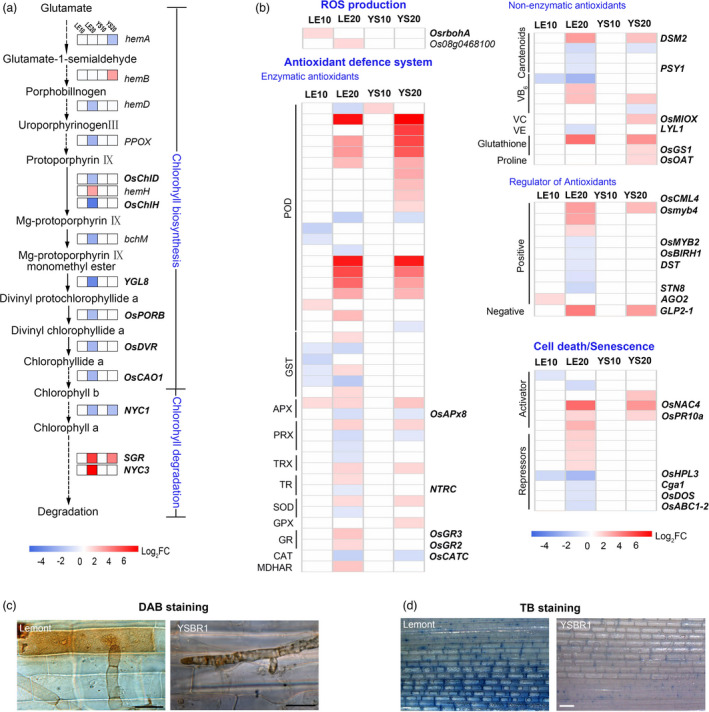
Figure 3.

Rhizoctonia solani triggered susceptible responses through the repression of chlorophyll and ROS metabolism. (a,b) Comparison of YSBR1 and Lemont DEGs involved in chlorophyll (a) and ROS metabolism (b). The scale bars display the Log2‐FC, shown in red when >0.75, in blue when <−0.75, and in white when −0.75 ~ 0.75. (c,d) Detection of hydrogen peroxide (H2O2) accumulation by 3,3′‐diaminobenzidine (DAB) staining (c) and cell death by trypan blue (TB) (d) in infected epidermal cells of leaf sheath at 20 HAI. Plants grown in natural conditions were inoculated at tilling stage. Scale bar, 20 μm in (c); 1 mm in (d).
