Figure 5.
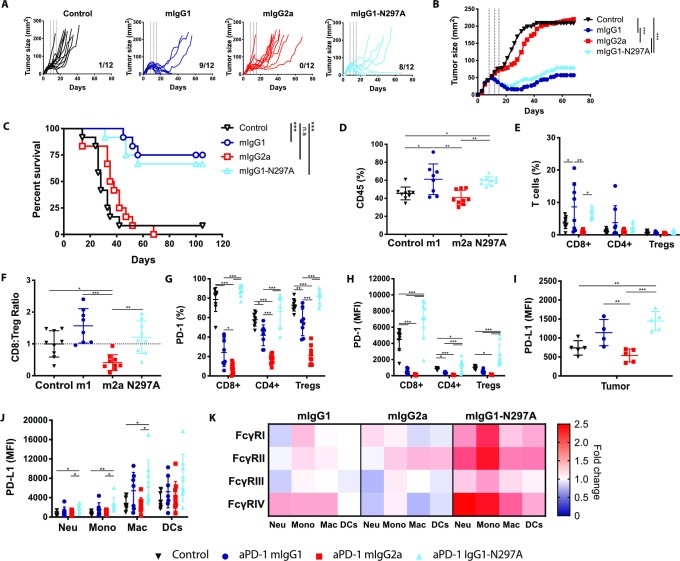
Anti-PD-1 mIgG1 and mIgG1-N297A augment antitumor immunity against MC38 tumors while mIgG2a abrogates therapeutic activity. C57BL/6 mice received 5×10⁵ MC38 cells s.c. on day 0. On days 8, 12, and 15 mice received 200 µg (i.p) anti-PD-1 isotypes or irrelevant mAbs. Tumor growth was monitored and mice culled when mean tumor area exceeded 225 mm2. Data are presented as tumor area (mm2) for each individual mouse (A) or the mean of the group (B). C) Kaplan-Meier curves showing percentage survival to humane end point on days after tumor inoculation. Experiment performed twice, N=12 mice per group. Log-rank (Mantel-Cox) Test, ***p<0.001. (D–K) Mice were sacrificed on day 16 and spleen and tumor analyzed by flow cytometry. (D, E) Frequency of CD45+ immune infiltrates (D) and T lymphocyte populations (expressed as % of CD45+ cells) (E). (F) CD8:Treg ratios expressed as fold change compared with control mice. (G, H) Expression of PD-1 on T lymphocyte populations as % (G) or MFI (H). (I, J) Expression of PD-L1 on tumor cells (I) or myeloid infiltrating subpopulations (J) presented as MFI. (K) Heat map indicating relative expression of FcγRs in treatment groups compared with controls. Colors represent the mean ratio of a group, where 1=no change; 1<downregulation; and 1>upregulation relative to controls. Experiment performed twice, N=7–9 mice per group. Bars represent mean±SD.D, *p<0.05, **p<0.01, ***p<0.001 (one-way ANOVA). ANOVA, analysis of variance; FcγRs, Fcγ receptors; MFI, mean fluorescence intensity; PD-1, programmed cell-death; s.c., subcutaneously.

