
Figure 1. Participant Disposition and Dosing During the Trial.
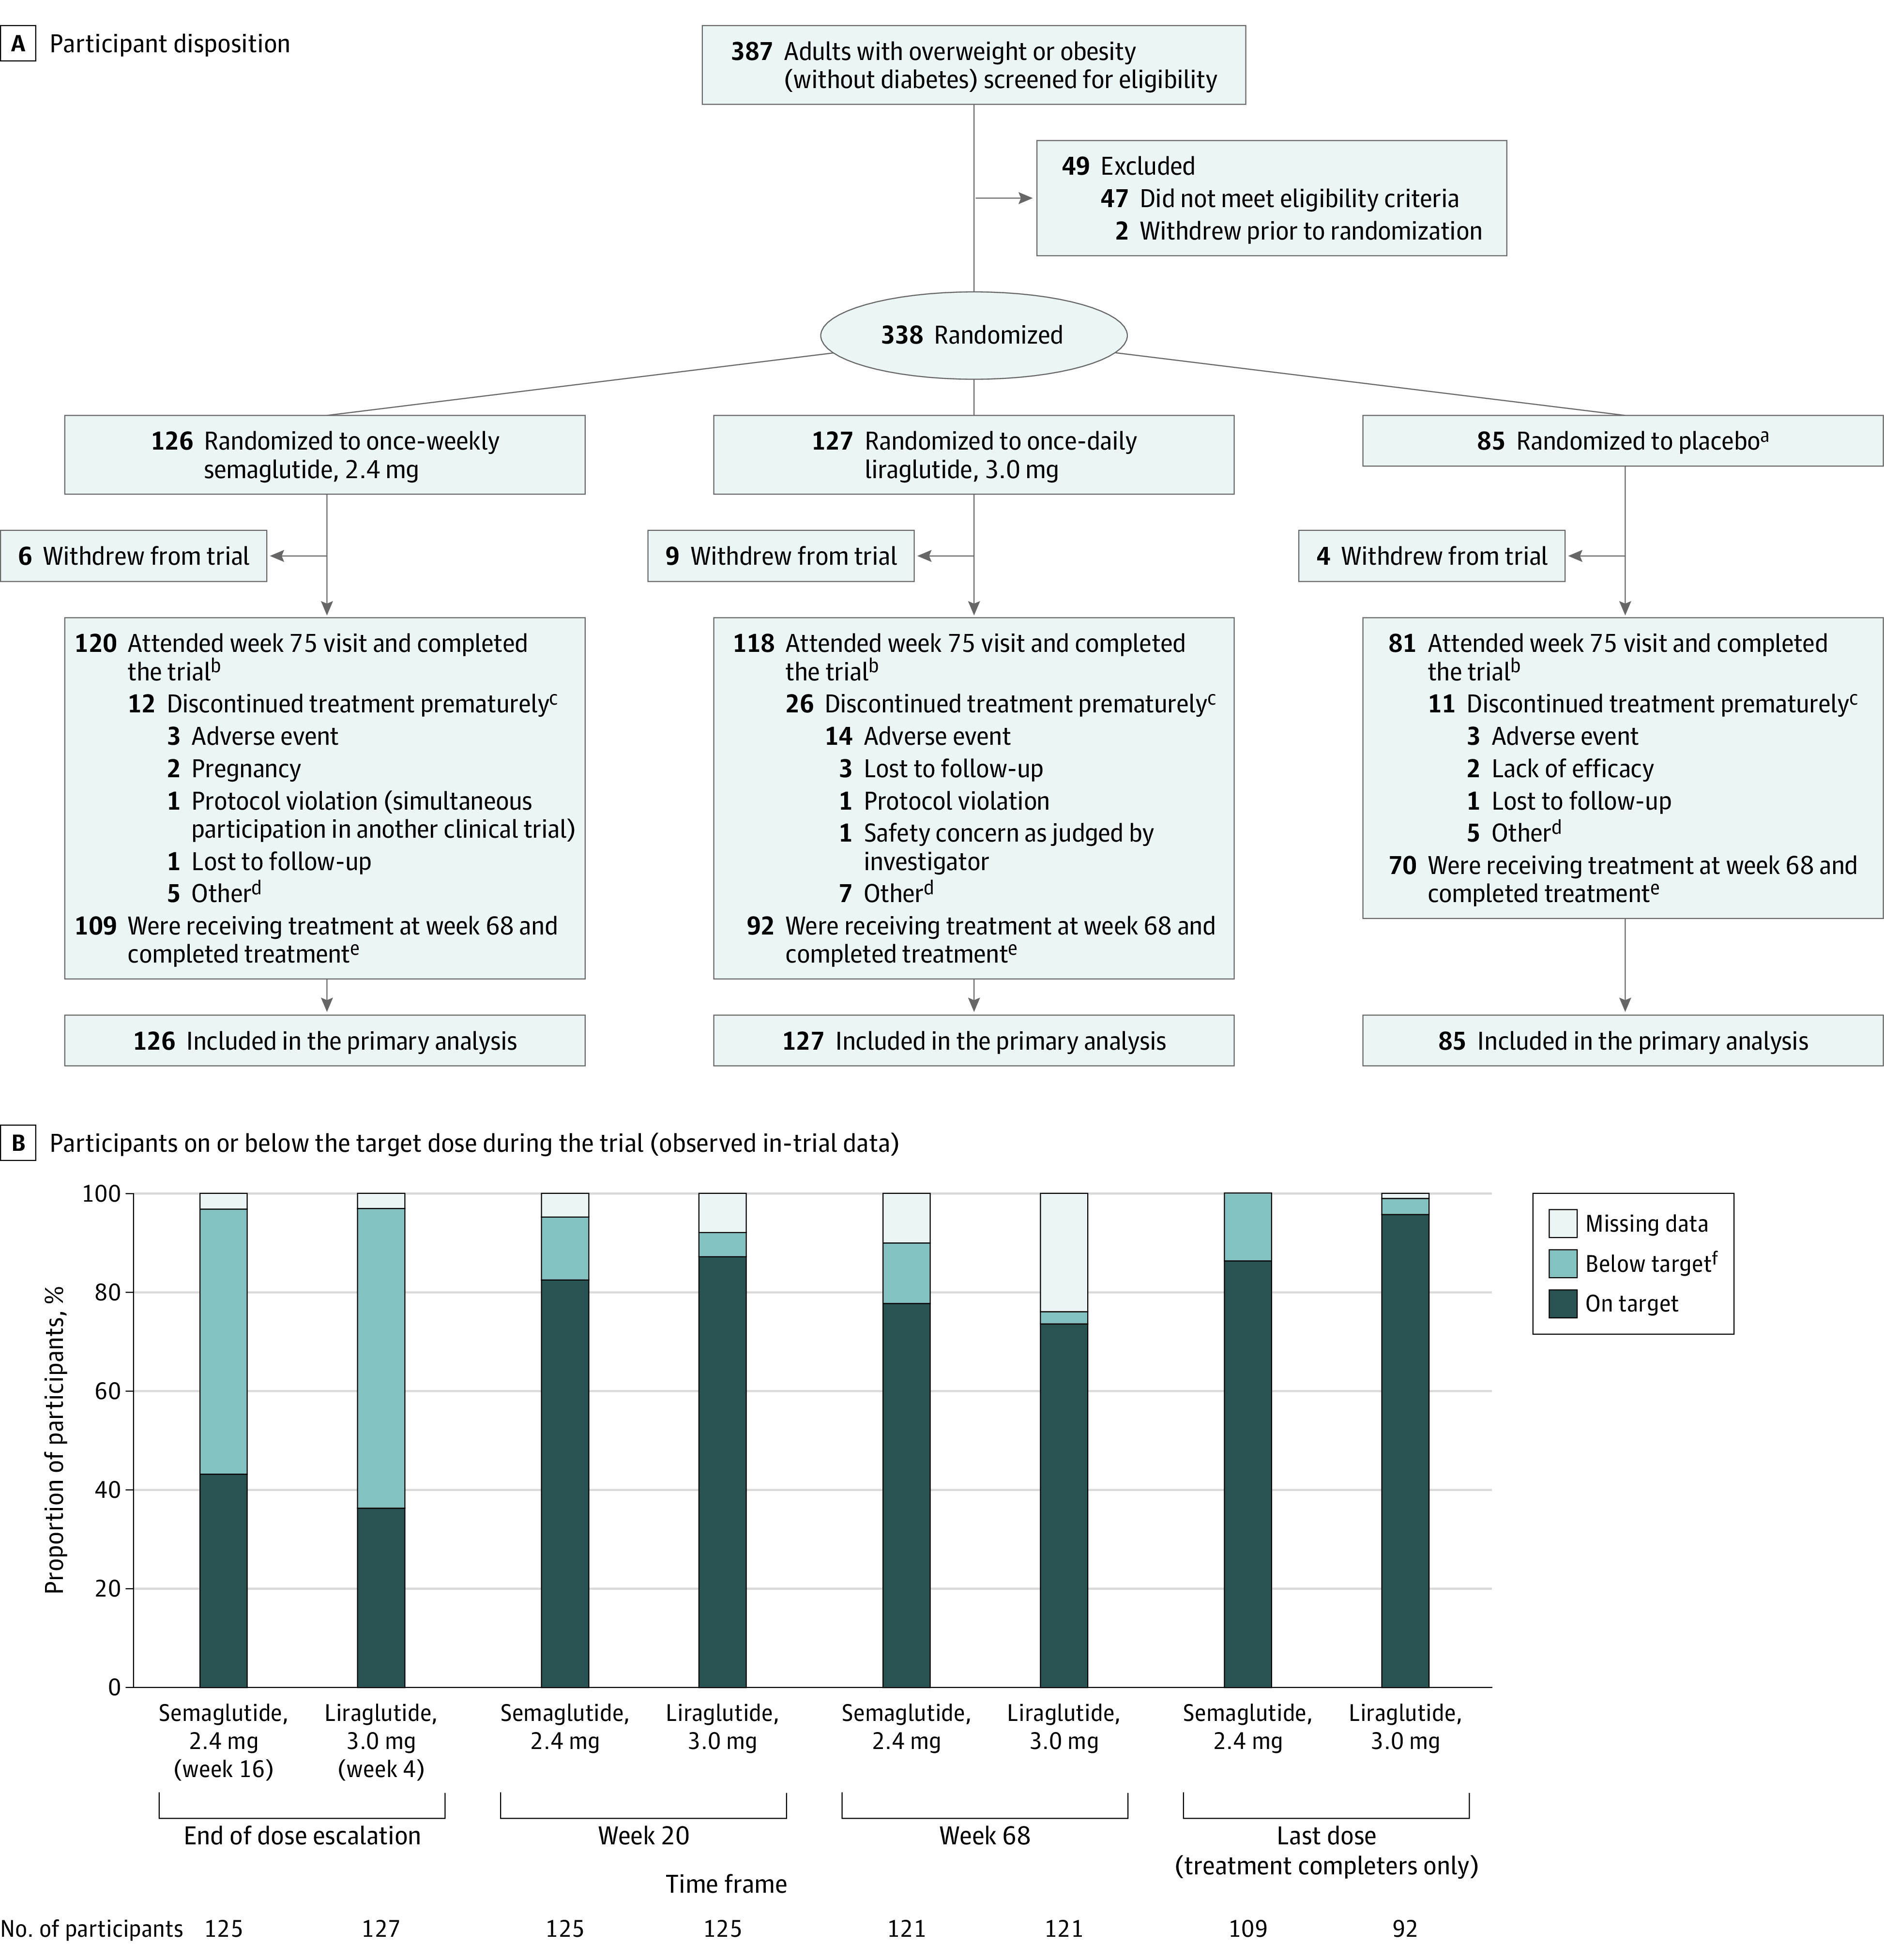
A, Flow of participants during the Semaglutide Treatment Effect in People With Obesity Trial. B, The proportions of participants on or below the target dose at the end of the dose escalation period (week 16 for semaglutide, week 4 for liraglutide), at weeks 20 and 68, and for the last dose. Data presented are observed (ie, as-measured) proportions during the in-trial period (the time from randomization to last contact with trial site, irrespective of treatment discontinuation or rescue intervention), based on the numbers of participants remaining in the trial at each time point (except for the last dose, which is based on the number of treatment completers). On target indicates a dose of 2.4 mg for semaglutide and 3.0 mg for liraglutide; below target, a dose of >0.0 to <2.4 mg for semaglutide and >0.0 to <3.0 mg for liraglutide; missing data, no dosing information was provided at the visit; and treatment completers, participants who were receiving treatment at week 68. Data are only presented for the active treatment groups.
aPooled placebo data. Data from the 2 placebo groups were pooled to increase power for statistical analyses of active treatments vs placebo, while limiting the number of participants required.
bThese participants were trial completers. Participants were considered trial completers if they attended the week 75 end–of–follow-up visit, regardless of whether they completed treatment.
cThese participants were trial completers who did not complete treatment.
dOther reasons for premature treatment discontinuation are listed in eTable 6 in Supplement 3.
eThese participants were treatment completers: they were receiving treatment at week 68, regardless of whether they completed the trial. One participant in the semaglutide group completed treatment without completing the trial.
fThe numbers and proportions of participants who were below the target dose are shown in eTable 7 in Supplement 3 and are based on the total number of participants with dose data at each time point (ie, excluding those with missing data).