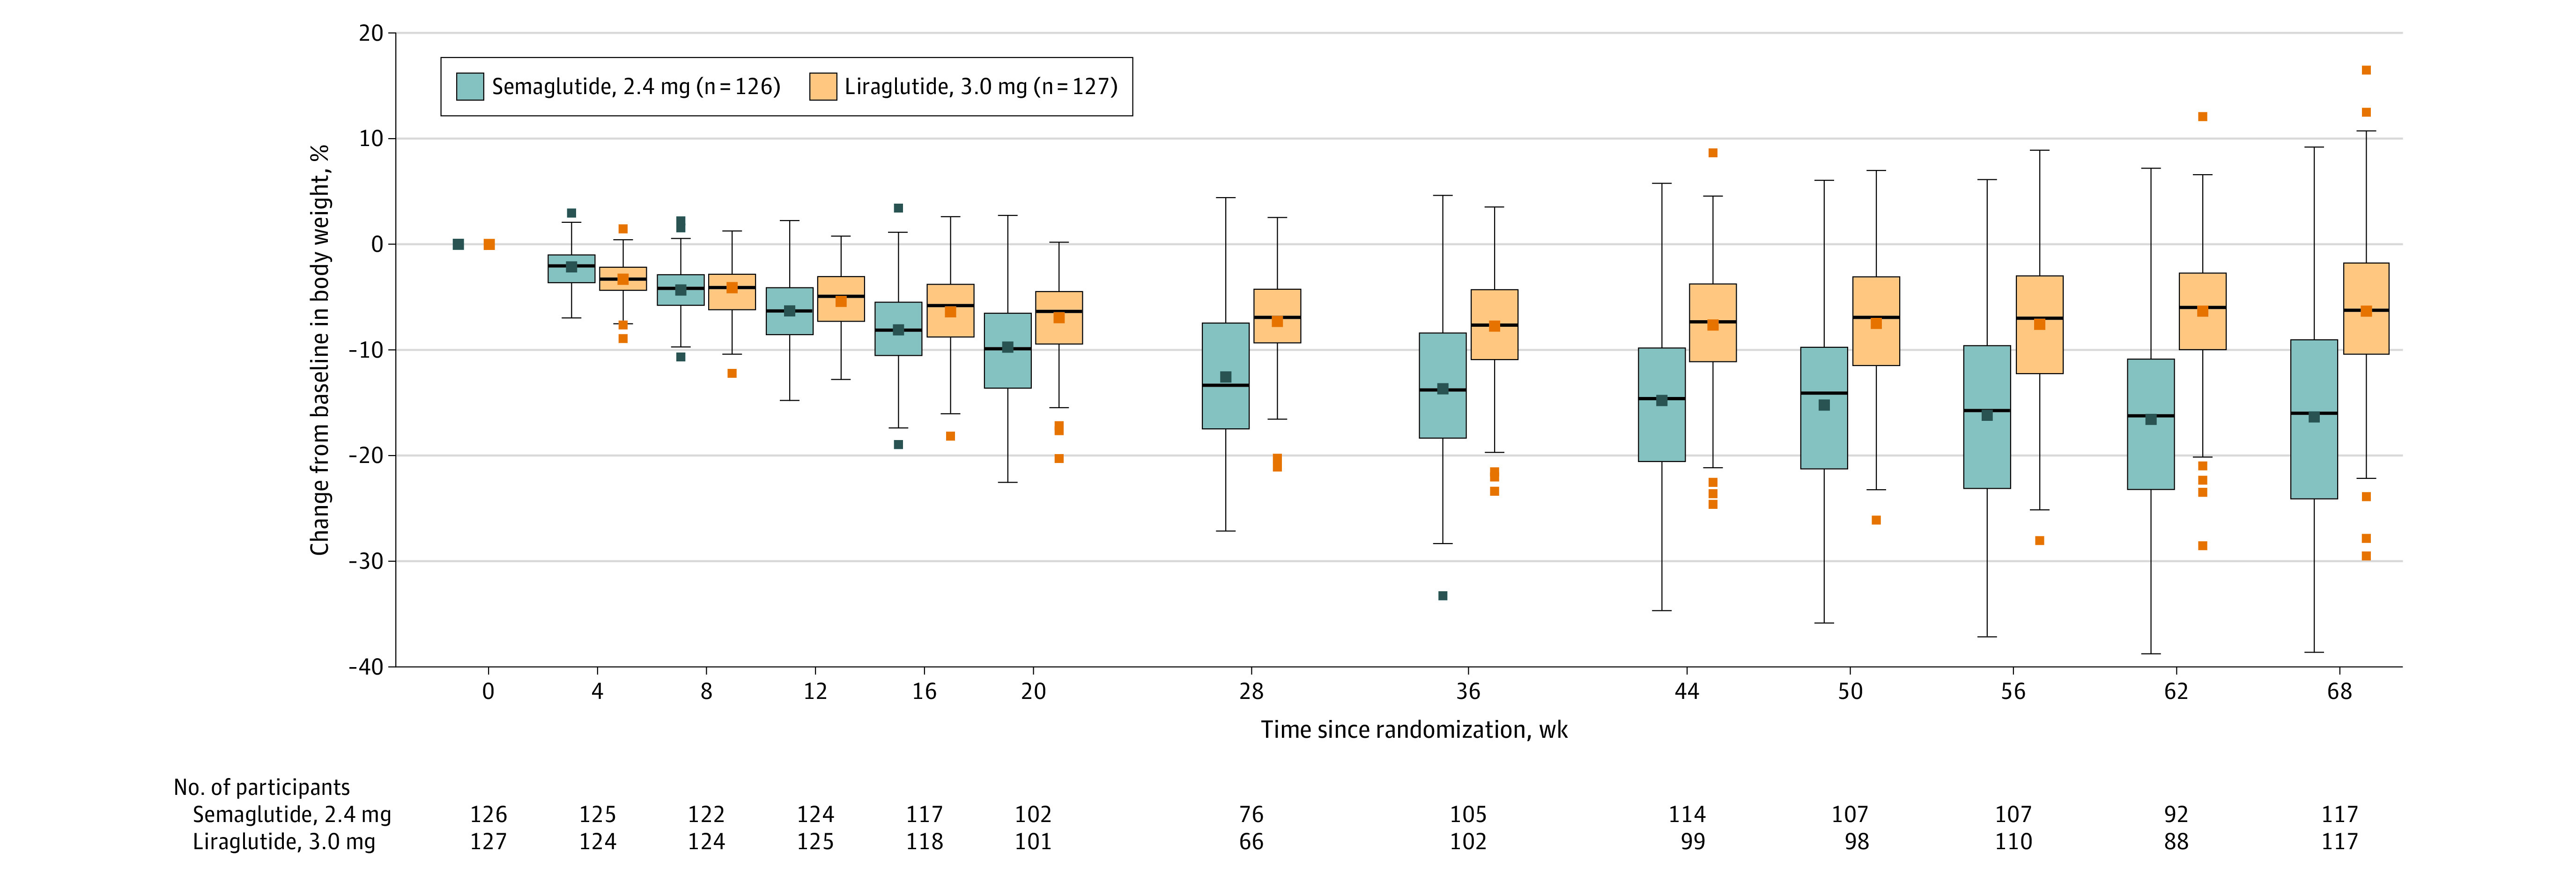
Figure 2. Percentage Change in Body Weight From Baseline to Week 68 (Observed In-Trial Data; Full Analysis Set).

Data presented are observed (ie, as-measured) changes during the in-trial period (the time from randomization to last contact with trial site, irrespective of treatment discontinuation or rescue intervention) for the full analysis set. Data for the on-treatment period are presented in eFigure 5 in Supplement 3. The middle lines within each box represent the median observed changes from baseline; the symbols in the boxes represent the mean observed percentage change; the box tops and bottoms represent the interquartile range; the whiskers extend to the most extreme observed values with 1.5 times the IQR of the nearer quartile; and the symbols beyond these points represent the observed values outside that range. More negative values indicate greater reductions. Numbers shown below the graph are the number of participants with observed data at each time point. Participant numbers in the legend are for the full analysis set. Data are only presented for the active treatment groups.
