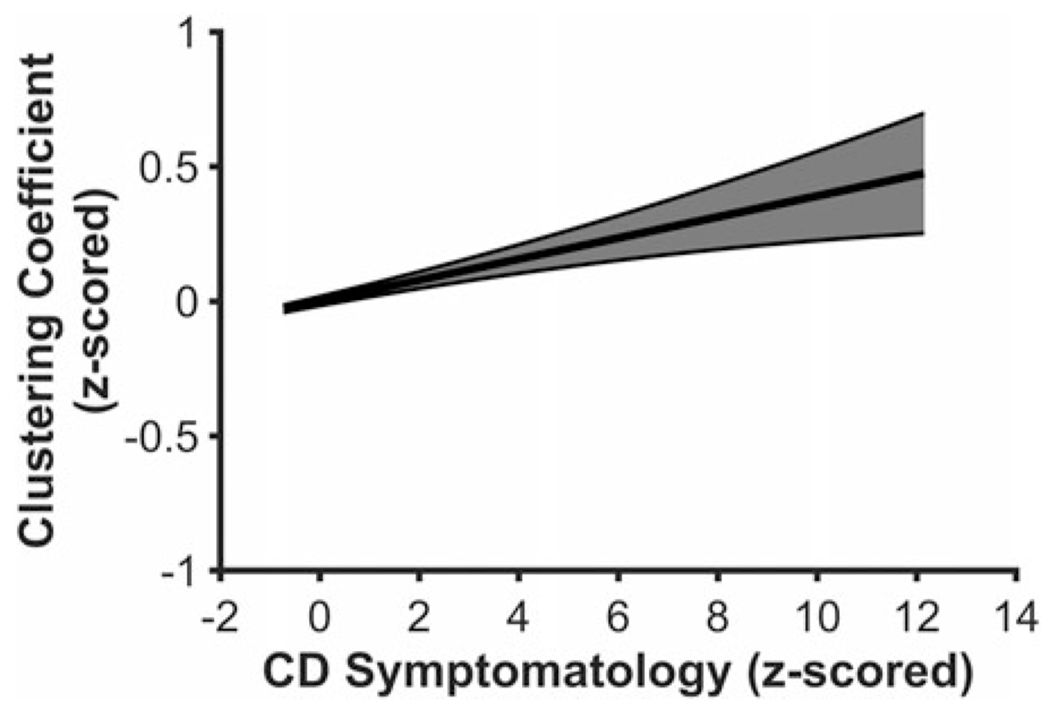
Figure 1.

Youth higher on conduct disorder (CD) symptomatology exhibited higher clustering coefficients in the global analysis. Figure 1 displays a regression line depicting clustering coefficient from the global analysis as a function of CD symptomatology, controlling for age, sex, race, and data collection site. Error band represents one standard error.
